如何绘制【逻辑回归】中threshold参数的学习曲线
threshold参数的意义是通过筛选掉低于threshold的参数,来对逻辑回归的特征进行降维。
首先导入相应的模块:
from sklearn.linear_model import LogisticRegression as LR
from sklearn.datasets import load_breast_cancer
from sklearn.model_selection import train_test_split
from sklearn.metrics import accuracy_score
import matplotlib.pyplot as plt
import numpy as np
from sklearn.feature_selection import SelectFromModel # 从模型中选择特征
from sklearn.model_selection import cross_val_score # 交叉验证
导入乳腺癌数据集:
data = load_breast_cancer()
x = data.data
y = data.target
查看数据集特征矩阵的情况:
data.data.shape # (569, 30)这个时候有30个特征。实例化一个逻辑回归模型,并使用交叉验证评估模型性能:
LR_ = LR(solver="liblinear", C=0.8, random_state=420)
cross_val_score(LR_, x, y, cv=10).mean() # 0.9508145363408522
使用select_from_model函数根据模型的权重系数或特征重要性等信息,选择重要的特征,并将选择后的特征矩阵返回给x_embedded:
X_embedded = SelectFromModel(LR_, threshold = 0.8, norm_order=1).fit_transform(x, y) # norm_order=1表示L1正则,模型会删除L1正则化后系数为0的特征,threshold表示阈值,当特征的系数小于阈值时,删除该特征
X_embedded.shape # (569, 9)
可以发现现在特征只剩下9个了。在这里我们设置了threshold = 0.8,也就是说小于0.8的权重系数被删除掉了。但是我们怎么知道设置哪个threshold值后得到的特征矩阵去训练模型,会得到最优的模型效果呢?
接下来我们开始绘制threshold的学习曲线,也就是不同的threshold值对模型效果的影响。在绘制之前,我们先训练模型,看一下权重系数的最大值,找到threshold的取值范围:
# 画threshod的学习曲线
LR_.fit(x, y) # 训练模型
LR_.coef_ # 查看训练后各变量的系数
LR_.coef_.shape # (1, 30)
LR_.coef_.max() # 1.9376881066687164
为了对比特征选择前和选择后模型的效果,我们设置了一组对照,同时确定了threshold的取值范围:
fullx = [] # 创建特征选择前的交叉验证的空列表
fsx = [] # 创建特征选择后的交叉验证的空列表
threshold = np.linspace(0, abs(LR_.fit(x, y).coef_).max(), 20) # 从0到最大系数之间取20个数
接下来绘制函数图像:
k = 0
for i in threshold:
    x_embedded = SelectFromModel(LR_, threshold=i).fit_transform(x, y) # threshold表示阈值,当特征的系数小于阈值时,删除该特征。此行代码是形成新的特征矩阵
    fullx.append(cross_val_score(LR_, x, y, cv=5).mean()) # 特征选择前进行交叉验证
    fsx.append(cross_val_score(LR_, x_embedded, y, cv=5).mean()) # 特征选择后进行交叉验证
    print((threshold[k], x_embedded.shape[1])) # 打印每次循环取到的阈值和降维后的特征数
    k += 1
plt.figure(figsize=(20, 5))
plt.plot(threshold, fullx, label="full")
plt.plot(threshold, fsx, label="feature selection")
plt.xticks(threshold)
plt.legend()
plt.show()
结果如下:
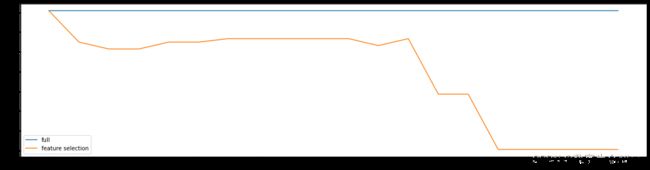
由图可知,随着threshold的值逐渐变大,被删除的特征越多,模型效果越差。这不是我们想要的结果,因此我们将范围缩小,将threshold的取值范围缩小(0,0.1),再来跑一下模型:
fullx = [] # 创建特征选择前的交叉验证的空列表
fsx = [] # 创建特征选择后的交叉验证的空列表
threshold = np.linspace(0, 0.1, 20) # 从0到最大系数之间取20个数
k = 0
for i in threshold:
    x_embedded = SelectFromModel(LR_, threshold=i).fit_transform(x, y) # threshold表示阈值,当特征的系数小于阈值时,删除该特征。此行代码是形成新的特征矩阵
    fullx.append(cross_val_score(LR_, x, y, cv=5).mean()) # 特征选择前进行交叉验证
    fsx.append(cross_val_score(LR_, x_embedded, y, cv=5).mean()) # 特征选择后进行交叉验证
    print((threshold[k], x_embedded.shape[1])) # 打印每次循环取到的阈值和降维后的特征数
    k += 1
plt.figure(figsize=(20, 5))
plt.plot(threshold, fullx, label="full")
plt.plot(threshold, fsx, label="feature selection")
plt.xticks(threshold)
plt.legend()
plt.show()
结果如下:
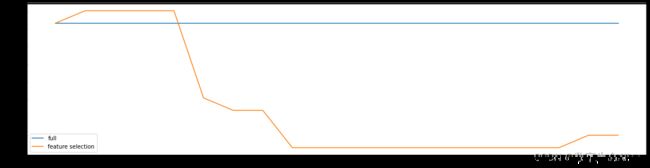 可以发现,当threshold取0.0053时,模型可以获得最好的效果。