使用MATLAB画上下两个横坐标与左右两个纵坐标
使用MATLAB画上下两个横坐标或者左右两个纵坐标
- 上下两个横坐标
-
- 同一条曲线对应两个坐标轴
- 两条曲线分别对应两个坐标轴
- 适用于R2019b及更高版本的新方法
- 左右两个纵坐标
上下两个横坐标
有时候画图会使用不同单位画在同一个曲线图中,希望两个单位分布在上下两个横坐标中。示例使用MATLAB 2016B。
同一条曲线对应两个坐标轴
使用位置设置让两个坐标系叠在一起:
position = [0.15 0.2 0.75 0.6];
set(gca,‘xaxislocation’,‘top’,‘yaxislocation’,‘left’,‘position’,position);

theta_degree = 0:360;
theta_rad = theta_degree/180*pi;
position = [0.15 0.2 0.75 0.6];
plot(theta_degree,sin(theta_rad),'Linewidth',4);   %这里画的被后面的覆盖了
set(gca,'xaxislocation','top','yaxislocation','left','position',position);
set(gca,'XTick',0:30:360);           %设置x轴刻度
xlabel('Degree');
set(gca,'Linewidth',2,'Fontsize',20,'box','on');
axes;
plot(theta_rad,sin(theta_rad),'Linewidth',4);hold on
xlabel('Rad');
set(gca,'xaxislocation','bottom','yaxislocation','right','position',position);
set(gca,'yticklabel',[]);
h = legend('sin\theta');
set(h,'box','off');			%不画方框
set(gca,'Linewidth',2,'Fontsize',20,'box','on');
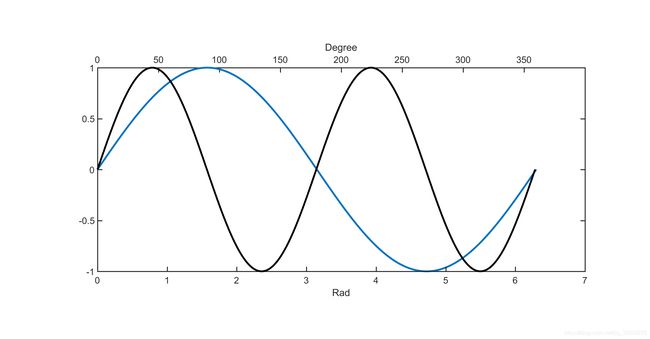
两条曲线分别对应两个坐标轴
注意使用’color’,'none’将坐标系背景设置为透明,使得上一个坐标系能够显示.同时还要注意,坐标系的框要去掉,‘box’,‘off’,不然坐标刻度会叠在一起。
theta_degree = 0:360;
theta_rad = theta_degree/180*pi;
position = [0.15 0.2 0.75 0.6];
plot(theta_degree,sin(theta_rad),'Linewidth',4);
set(gca,'xaxislocation','top','yaxislocation','left','position',position);
set(gca,'XTick',0:50:360);           %设置x轴刻度
xlabel('Degree');
set(gca,'Linewidth',2,'Fontsize',20,'box','off');
axes;
plot(theta_rad,sin(theta_rad*2),'Linewidth',4,'color','k');
xlabel('Rad');
set(gca,'xaxislocation','bottom','yaxislocation','right','color','none','position',position);
set(gca,'yticklabel',[]);
set(gca,'Linewidth',2,'Fontsize',20,'box','off');
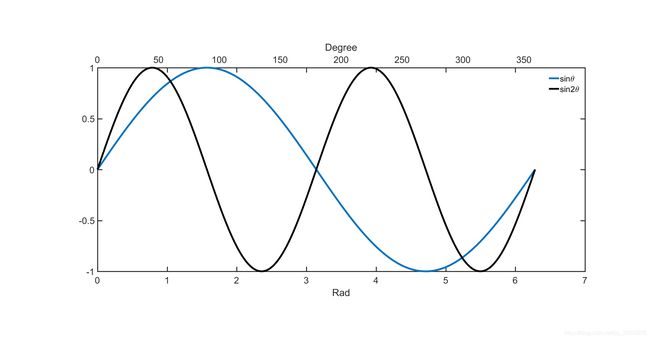
但是这样两条曲线就不能legend到一起了,因为变成了两个坐标系,只是通过设置位置重合在一起。解决办法就是像上一个一样,将第一个坐标系覆盖,color 不要设置为透明,把所有图都画到第二个坐标系。如下:
theta_degree = 0:360;
theta_rad = theta_degree/180*pi;
position = [0.15 0.2 0.75 0.6];
plot(theta_degree,sin(theta_rad),'Linewidth',4);
set(gca,'xaxislocation','top','yaxislocation','left','position',position);
set(gca,'XTick',0:50:360);           %设置x轴刻度
xlabel('Degree');
set(gca,'Linewidth',2,'Fontsize',20,'box','on');
axes;
plot(theta_rad,sin(theta_rad),'Linewidth',4);hold on
plot(theta_rad,sin(theta_rad*2),'Linewidth',4,'color','k');
xlabel('Rad');
set(gca,'xaxislocation','bottom','yaxislocation','right','position',position);
set(gca,'yticklabel',[]);
h = legend('sin\theta','sin2\theta');
set(h,'box','off');
set(gca,'Linewidth',2,'Fontsize',20,'box','on');
适用于R2019b及更高版本的新方法
https://ww2.mathworks.cn/help/matlab/creating_plots/graph-with-multiple-x-axes-and-y-axes.html
使用tiledlayout函数代替了上述手动编写position的功能,tiledlayout函数与subplot函数类似,但是可以自由配置绘图,功能更多。
theta_degree = 0:360;
theta_rad = theta_degree/180*pi;
% position = [0.15 0.2 0.75 0.6];
t = tiledlayout(1,1);
ax1 = axes(t);
% plot(theta_degree,sin(theta_rad),'Linewidth',4);
plot(ax1,theta_degree,sin(theta_rad),'Linewidth',4);
% set(gca,'xaxislocation','top','yaxislocation','left','position',position);
set(gca,'xaxislocation','top','yaxislocation','left');
set(gca,'XTick',0:60:360);           %设置x轴刻度
xlabel('Degree');
set(gca,'Linewidth',2,'Fontsize',20,'box','on');
% axes;
ax2 = axes(t);
% plot(theta_rad,sin(theta_rad),'Linewidth',4);hold on
% plot(theta_rad,sin(theta_rad*2),'Linewidth',4,'color','k');
plot(ax2,theta_rad,sin(theta_rad),'Linewidth',4);hold on
plot(ax2,theta_rad,sin(theta_rad*2),'Linewidth',4,'color','k');
xlabel('Rad');
% set(gca,'xaxislocation','bottom','yaxislocation','right','position',position);
set(gca,'xaxislocation','bottom','yaxislocation','right');
set(gca,'yticklabel',[]);
h = legend('sin\theta','sin2\theta');
set(h,'box','off');
set(gca,'Linewidth',2,'Fontsize',20,'box','on');
结果与上图相同。
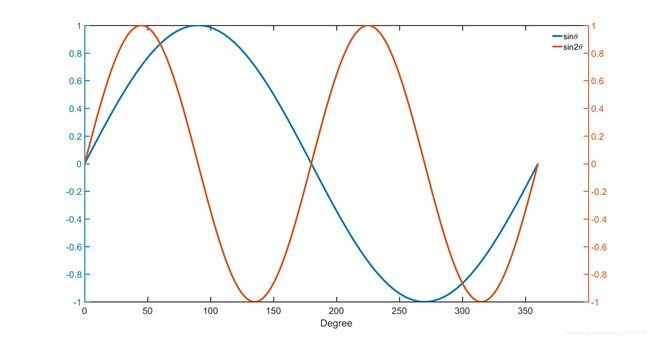
左右两个纵坐标
使用上述方法同样可以实现两个纵坐标画到一个图,但是MATLAB提供了另一个方便的函数来实现:yyaxis left和yyaxis right (之前的MATLAB版本里面是通过plotyy函数实现)。
theta_degree = 0:360;
theta_rad = theta_degree/180*pi;
position = [0.15 0.2 0.75 0.6];
yyaxis left
plot(theta_degree,sin(theta_rad),'Linewidth',4);hold on

yyaxis right
plot(theta_degree,sin(theta_rad*2),'Linewidth',4);
xlabel('Degree');
set(gca,'XTick',0:50:360);           %设置x轴刻度
h = legend('sin\theta','sin2\theta');
set(h,'box','off');
set(gca,'Linewidth',2,'Fontsize',20,'box','on');