【gridsample】地平线如何支持gridsample算子
文章目录
- 1. grid_sample算子功能解析
-
- 1.1 理论介绍
- 1.2 代码分析
-
- 1.2.1 x,y取值范围[-1,1]
- 1.2.2 x,y取值范围超出[-1,1]
- 2. 使用grid_sample算子构建一个网络
- 3. 走PTQ进行模型转换与编译
- 4. 走QAT进行模型转换与编译
实操以J5 OE1.1.60对应的docker为例
1. grid_sample算子功能解析
该段主要参考:https://blog.csdn.net/jameschen9051/article/details/124714759,不想看理论可直接跳至第2节
1.1 理论介绍
在图像处理领域,grid_sample 是一个常用的操作,通常用于对图像进行仿射变换或透视变换。它可以在给定输入图像和一个变换矩阵的情况下,对输入图像进行采样,生成一个新的输出图像。
pytorch中调用接口:
torch.nn.functional.grid_sample(input,grid,mode='bilinear',padding_mode='zeros',align_corners=None)
- input:输入特征图,可以是四维或者五维张量,本文主要以四维为例进行介绍,表示为 (N,C,Hin,Win) 。
- grid:采样网格,包含输出特征图的shape大小(Hout、Wout),每个 网格值 通过变换对应到输入特征图的采样点位,当对应四维input时,其张量形式为(N,Hout,Wout,2),其中最后一维大小必须为2,如果输入input为五维张量,那么最后一维大小必须为3。
为什么最后一维必须为2或者3?因为grid的最后一个维度实际上代表一个坐标(x,y)或者(x,y,z),对应到输入特征图的二维或三维特征图的坐标维度,x,y取值范围一般为[-1,1],该范围映射到输入特征图的全图,一通操作变换后对应于输出图像上的一个像素点。
- mode:采样模式,可以是 ‘bilinear’(双线性插值)、 ‘nearest’(最近邻插值)、‘bicubic’ 双三次插值。。
- padding_mode:填充模式,用于处理采样时超出输入图像边界的情况,可以是 ‘zeros’ 、 ‘border’、 ‘reflection’。
- align_corners:一个布尔值,用于指定特征图坐标与特征值对应方式,设定为TRUE时,特征值位于像素中心。
总的说来,grid_sample 算子会根据给定的网格(grid)在输入图像上进行采样,然后根据选择的插值方法在采样点周围的像素上进行插值,最终生成输出图像。
画一个在BEV方案中grid_sample原理图来帮助理解grid_sample怎么回事:

1.2 代码分析
对照代码进行下一步解读。
假设输入shape为(N,C,H_in,W_in),grid的shape设定为(N,H_out,W_out,2),使用双线性差值,填充模式为zeros,align_corners需要设置为True。
首先根据input和grid设定,输出特征图tensor的shape为(N,C,H_out,W_out),输出特征图上每一个cell上的值与grid最后一维(x,y)息息相关,那么如何计算输出tensor上每一个点的值?
首先,通过(x,y)找到输入特征图上的采样位置:由于x,y取值范围为[-1,1],为了便于计算,先将x,y取值范围调整为[0,1],方法是(x+1)/2,(y+1)/2。因此,将x,y映射为输入特征图的具体坐标位置:(w-1)(x+1)/2、(h-1)(y+1)/2。
将x,y映射到输入特征图实际坐标后,取该坐标附近四个角点特征值,通过四个特征值坐标与采样点坐标相对关系进行双线性插值,得到采样点的值。
注意:x,y映射后的坐标可能是输入特征图上任意位置。
基于上面的思路,可以进行一个简单的自定义实现。根据指定shape生成input和grid,之后取grid中的第一个位置中的x,y,根据x,y从input中通过双线性插值计算出output第一个位置的值。类比使用pytorch中的grid_sample算子生成output。
其它的看代码注释即可。
1.2.1 x,y取值范围[-1,1]
import torch
import numpy as np

def grid_sample(input, grid):
    N, C, H_in, W_in = input.shape
    N, H_out, W_out, _ = grid.shape
    output = np.random.random((N,C,H_out,W_out))
    for i in range(N):
        for j in range(C):
            for k in range(H_out):
                for l in range(W_out):
                    param = [0.0, 0.0]
                    # 通过(w-1)*(x+1)/2、(h-1)*(y+1)/2将x,y映射为输入特征图的具体坐标位置。
                    param[0] = (W_in - 1) * (grid[i][k][l][0] + 1) / 2
                    param[1] = (H_in - 1) * (grid[i][k][l][1] + 1) / 2
                    x0 = int(param[0])  # int取整规则:将小数部分截断去掉。
                    x1 = x0 + 1
                    y0 = int(param[1])
                    y1 = y0 + 1
                    param[0] -= x0  # 此时param里装的是小数部分
                    param[1] -= y0
                    # 双线性插值
                    left_top = input[i][j][y0][x0] * (1 - param[0]) * (1 - param[1])
                    left_bottom = input[i][j][y1][x0] * (1 - param[0]) * param[1]
                    right_top = input[i][j][y0][x1] * param[0] * (1 - param[1])
                    right_bottom = input[i][j][y1][x1] * param[0] * param[1]
                    result = left_bottom + left_top + right_bottom + right_top
                    output[i][j][k][l] = result
    return output

if __name__=='__main__':
    N, C, H_in, W_in, H_out, W_out = 1, 1, 4, 4, 2, 2

    input = np.random.random((N,C,H_in,W_in))
    # np.random.random()范围是[0,1),想要[a,b)的数据,需要(b-a)*np.random.random() + a
    grid = -1 + 2*np.random.random((N,H_out,W_out,2))  # 最后一维2,生成了坐标

    out = grid_sample(input, grid)
    print(f'自定义实现输出结果:\n{out}')

    input = torch.from_numpy(input)
    grid = torch.from_numpy(grid)
    # 注意:这儿align_corners=True
    output = torch.nn.functional.grid_sample(input,grid,mode='bilinear', padding_mode='zeros',align_corners=True)
    print(f'grid_sample输出结果:\n{output}')
注意:这里没有对超出[-1,1]范围的x,y值做处理,只能处理四维input,五维input的实现思路与这里基本一致:再加一层循环,内插算法改为3维。。
1.2.2 x,y取值范围超出[-1,1]
考虑到(x,y)取值范围可能越界,pytorch中的padding_mode设置就是对(x,y)落在输入特征图外边缘情况进行处理,一般设置’zero’,也就是对靠近输入特征图范围以外的采样点进行0填充,如果不进行处理显然会造成索引越界。要解决(x,y)越界问题,可以进行如下修改:
import torch
import numpy as np

def grid_sample(input, grid):
    N, C, H_in, W_in = input.shape
    N, H_out, W_out, _ = grid.shape
    output = np.random.random((N,C,H_out,W_out))
    for i in range(N):
        for j in range(C):
            for k in range(H_out):
                for l in range(W_out):
                    param = [0.0, 0.0]
                    # 通过(w-1)*(x+1)/2、(h-1)*(y+1)/2将x,y映射为输入特征图的具体坐标位置。
                    param[0] = (W_in - 1) * (grid[i][k][l][0] + 1) / 2
                    param[1] = (H_in - 1) * (grid[i][k][l][1] + 1) / 2
                    x1 = int(param[0] + 1)  # int取整规则:将小数部分截断去掉。
                    x0 = x1 - 1
                    y1 = int(param[1] + 1)
                    y0 = y1 - 1
                    param[0] = abs(param[0] - x0)  # 此时param里装的是离x0,y0的距离
                    param[1] = abs(param[1] - y0)

                    # 填充
                    left_top_value, left_bottom_value, right_top_value, right_bottom_value = 0, 0, 0, 0
                    if 0 <= x0 < W_in and 0 <= y0 < H_in:
                        left_top_value = input[i][j][y0][x0]
                    if 0 <= x1 < W_in and 0 <= y0 < H_in:
                        right_top_value = input[i][j][y0][x1]
                    if 0 <= x0 < W_in and 0 <= y1 < H_in:
                        left_bottom_value = input[i][j][y1][x0]
                    if 0 <= x1 < W_in and 0 <= y1 < H_in:
                        right_bottom_value = input[i][j][y1][x1]

                    # 双线性插值
                    left_top = left_top_value * (1 - param[0]) * (1 - param[1])
                    left_bottom = left_bottom_value * (1 - param[0]) * param[1]
                    right_top = right_top_value * param[0] * (1 - param[1])
                    right_bottom = right_bottom_value * param[0] * param[1]
                    result = left_bottom + left_top + right_bottom + right_top
                    output[i][j][k][l] = result
    return output

if __name__=='__main__':
    N, C, H_in, W_in, H_out, W_out = 1, 1, 4, 4, 2, 2

    input = np.random.random((N,C,H_in,W_in))
    # np.random.random()范围是[0,1),想要[a,b)的数据,需要(b-a)*np.random.random() + a
    grid = -1 + 2*np.random.random((N,H_out,W_out,2))  # 最后一维2,生成了坐标
    grid[0][0][0] = [-1.2, 1.3]     # 超出[-1,1]的范围

    out = grid_sample(input, grid)
    print(f'自定义实现输出结果:\n{out}')

    input = torch.from_numpy(input)
    grid = torch.from_numpy(grid)
    # 注意:这儿align_corners=True
    output = torch.nn.functional.grid_sample(input,grid,mode='bilinear', padding_mode='zeros',align_corners=True)
    print(f'grid_sample输出结果:\n{output}')
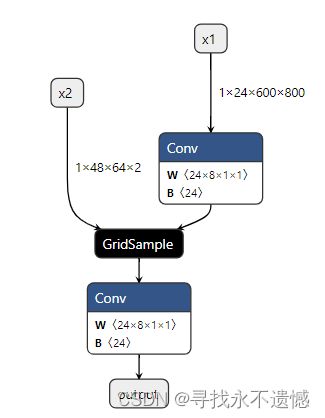
2. 使用grid_sample算子构建一个网络
据此,构建一个简单的网络,test.py代码如下:
import torch
import torch.nn as nn
import torch.nn.functional as F

from horizon_nn.torch import export_onnx

class GridSampleModel(nn.Module):
    def __init__(self):
        super(GridSampleModel, self).__init__()

        self.unitconv = nn.Conv2d(24, 24, (1, 1), groups=3)
        nn.init.constant_(self.unitconv.weight, 1)
        nn.init.constant_(self.unitconv.bias, 0)


    def forward(self, x1, x2):
        x1 = self.unitconv(x1)
        x = F.grid_sample(x1,
                          grid=x2,
                          mode='bilinear',
                          padding_mode='zeros',
                          align_corners=True)
        x = self.unitconv(x)
        return x

if __name__ == "__main__":
    model = GridSampleModel()
    model.eval()

    input_names = ['x1', 'x2']
    output_names = ['output']
    x1 = torch.randn((1, 24, 600, 800))
    x2 = torch.randn((1, 48, 64, 2))

    export_onnx(model, (x1, x2), 'gridsample.onnx',
                verbose=True, opset_version=11,
                input_names=input_names, output_names=output_names)

    print('convert to gridsampe onnx finish!!!')
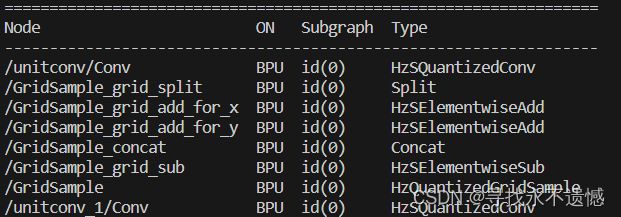
3. 走PTQ进行模型转换与编译
对应config.yaml文件:
# 模型转化相关的参数
model_parameters:
  onnx_model: './gridsample.onnx'
  march: "bayes"
  working_dir: 'model_output'
  output_model_file_prefix: 'gridsample'

# 模型输入相关参数, 若输入多个节点, 则应使用';'进行分隔, 使用默认缺省设置则写None
input_parameters:
  input_name: "x1;x2"
  input_type_rt: 'featuremap;featuremap'
  input_layout_rt: 'NCHW;NCHW'
  input_type_train: 'featuremap;featuremap'
  input_layout_train: 'NCHW;NCHW'
  input_shape: '1x24x600x800;1x48x64x2'
  norm_type: 'no_preprocess;no_preprocess'

# 模型量化相关参数
calibration_parameters:
  calibration_type: 'skip'

# 编译器相关参数
compiler_parameters:
  compile_mode: 'latency'
  optimize_level: 'O3'
使用的是OE1.1.60对应的docker
hb_mapper makertbin --config config.yaml --model-type onnx
4. 走QAT进行模型转换与编译
对应的是plugin-fx,关于该部分基础解读可见另外一篇文章:https://blog.csdn.net/weixin_45377629/article/details/131354320
可运行代码如下:
import os
import torch
import torch.nn as nn
import torch.nn.functional as F

# torch中的一个类,主要用于将量化操作的结果转换回浮点数,也就是对输出数据转换回浮点数
from torch.quantization import DeQuantStub
# 硬件芯片架构,J5:bayes;XJ3:bernoulli2,具体可看源码
from horizon_plugin_pytorch.march import March, set_march
from horizon_plugin_pytorch.quantization import (
    QuantStub,      # 类似于torch中的类QuantStub,用于将输入数据量化,使用plugin中的QuantStub是因为它支持通过参数手动固定 scale
    convert_fx,     # 将伪量化模型qat_model转换为定点模型quantized_model
    prepare_qat_fx, # 将float模型转成calib/qat模型,变动表现:进行一些conv+bn等算子融合
    set_fake_quantize,  # 用于设置qat/calib model 伪量化状态,内参包括FakeQuantState
    FakeQuantState,     # 用于设置伪量化状态,有FakeQuantState.QAT用于qat model train,FakeQuantState.VALIDATION用于qat/calib model eval,FakeQuantState.CALIBRATION用于 calib eval
    check_model,        # 用于检查模型是否可以被硬件支持,本例中输入是可序列化的script_model,并给出一些根据硬件对齐规则可以提升性能的建议
    compile_model,      # 用于编译生成可以上板的hbm模型
    perf_model,         # 用于推测模型耗时等信息
    visualize_model,    # 用于可视化算子优化替换后的模型结构
)
from horizon_plugin_pytorch.quantization.qconfig import (
    default_calib_8bit_fake_quant_qconfig,      # 校准时,模型总体伪量化节点的量化配置
    default_qat_8bit_fake_quant_qconfig,        # 量化训练时,模型总体伪量化节点的量化配置
    default_qat_8bit_weight_32bit_out_fake_quant_qconfig,    # 模型输出的伪量化节点配置,用于配置输出conv节点高精度int32输出
    default_calib_8bit_weight_32bit_out_fake_quant_qconfig,  # 和上一行是一个东西
)

class GridSampleModel(nn.Module):
    def __init__(self):
        super(GridSampleModel, self).__init__()

        self.unitconv = nn.Conv2d(24, 24, (1, 1), groups=3)
        nn.init.constant_(self.unitconv.weight, 1)
        nn.init.constant_(self.unitconv.bias, 0)

    def forward(self, x1, x2):
        x1 = self.unitconv(x1)
        x = F.grid_sample(x1,
                          grid=x2,
                          mode='bilinear',
                          padding_mode='zeros',
                          align_corners=True)
        x = self.unitconv(x)
        return x

class FxQATReadyGridSample(GridSampleModel):
    def __init__(self):
        super().__init__()
        self.quant = QuantStub()
        self.dequant = DeQuantStub()

    def forward(self, x1, x2):
        x1 = self.quant(x1)
        x2 = self.quant(x2)
        x = super().forward(x1, x2)
        x = self.dequant(x)

        return x

def compile(
    model,
    model_path,
    compile_opt=3,
    march=March.BAYES,
    quant_method="fx",
):
    # 定点模型
    quantized_model = model

    x1 = torch.randn((1, 24, 600, 800))
    x2 = torch.randn((1, 48, 64, 2))
    example_input = (x1,x2)     # Tensor

    # 单纯为了更保险,这儿再次加上.cpu()
    script_model = torch.jit.trace(quantized_model.cpu(), example_input)
    # pt 模型指 torchscript 模型,以.pt结尾
    torch.jit.save(script_model, os.path.join(model_path, "int_model.pt"))

    check_model(script_model, example_input, advice=1)

    compile_model(
        script_model,
        example_input,
        hbm=os.path.join(model_path, "model.hbm"),
        input_source="ddr,ddr",     # 上板时输入的数据来源,通常有ddr/resizer/pyramid,多输入时配置为字符串列表
        opt=compile_opt,
    )

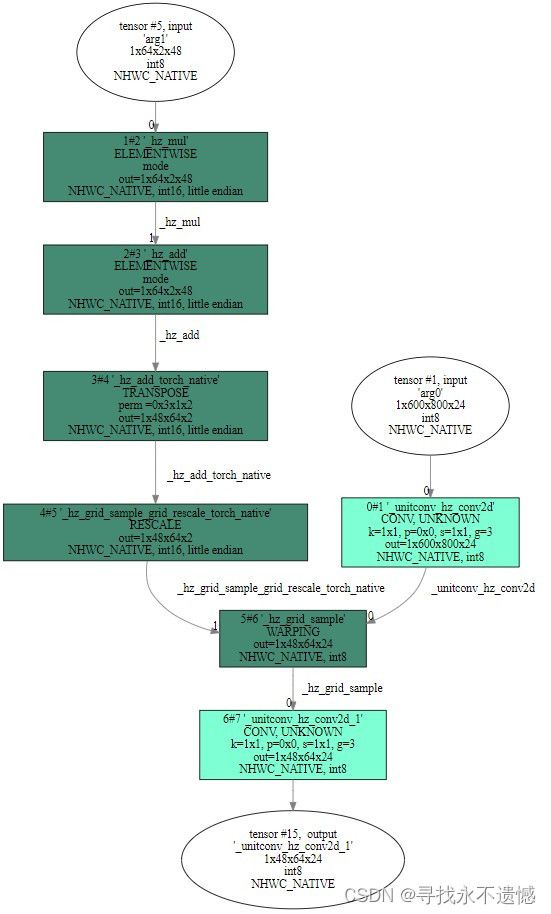
    # 可视化torchscript模型,也就是hbdk眼中的模型,会考虑到layout的变换、硬件对齐、算子融合、算子等效替换等情况
    visualize_model(
        script_model,
        example_input,
        save_path=os.path.join(model_path, "model.svg"),
        show=False,
    )

    return script_model

if __name__ == "__main__":
    device = torch.device('cpu')
    float_model = FxQATReadyGridSample().to(device)
    print(float_model)

    set_march(March.BAYES)

    calib_model = prepare_qat_fx(
        float_model,
        {
            "": default_calib_8bit_fake_quant_qconfig,
        },
    ).to(device)

    quantized_model = convert_fx(calib_model).to(device)

    model_path = './model_path'
    compile(quantized_model, model_path)


