C/C++调试工具 - gdb详解
C/C++调试工具 -gdb详解
- 1 简介
- 2 常用的命令
- 3 使用的条件
- 4 程序调试
-
- 4.1 直接运行程序
- 4.2 断点调试(在某一行)
- 4.3 断点调试(在函数入口处打断点)
- 5 调试core文件
-
- 5.1 生成core文件的方法
- 5.2 调试core文件
1 简介
GDB是Linux下非常好用且强大的调试工具。GDB可以调试C、C++、Go、java、 objective-c、PHP等语言,是做后端软件开发必备的工具
可以完成如下的功能 :
- 1 按照自定义的方式启动运行需要调试的程序
- 2 程序暂停时的值的监视
- 动态改变程序的执行环境
2 常用的命令
| 命令 | 详解 |
|---|---|
| file filename | 加载被调试的可执行文件 |
| run | 重新开始运行文件 |
| start | 单步执行 运行程序 停在第一执行语句 |
| list | 查看源代码 |
| set | 设置变量的值 |
| start | 单步执行 运行程序 停在第一执行语句 |
| next | 单步跳过(直接执行函数) |
| step | 单步执行 进入函数内部执行 |
| backtrace | 查看函数的调用栈帧和层级关系(简写bt) |
| frame | 切换的函数的栈帧 |
| info | 查看函数内部局部变量的值 |
| finish | 结束当前函数 回到函数的调用点 |
| continue | 继续执行 简写c |
| 打印值及地址 简写p | |
| quit | 退出gdb |
3 使用的条件
在编译时使用 g++/gcc -g选项
查看是否带有编译信息
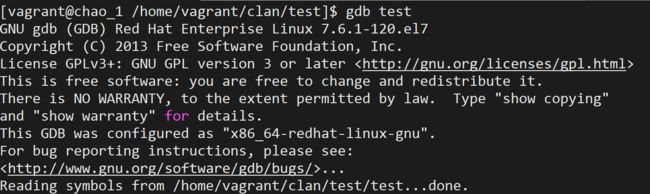
如上所示则表示带有调试信息
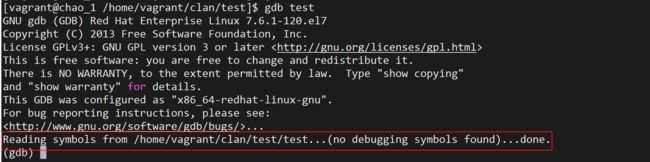
如上所示,则表示编译时没有带 -g选项 因此无法是gdb进行调试
4 程序调试
4.1 直接运行程序
使用gdb工具运行的代码如下
#include
编译
gcc -g test.c -o test
gdb 运行
[root@chao_1 /home/vagrant/clan/test]$ gdb test
GNU gdb (GDB) Red Hat Enterprise Linux 7.6.1-120.el7
Copyright (C) 2013 Free Software Foundation, Inc.
License GPLv3+: GNU GPL version 3 or later <http://gnu.org/licenses/gpl.html>
This is free software: you are free to change and redistribute it.
There is NO WARRANTY, to the extent permitted by law.  Type "show copying"
and "show warranty" for details.
This GDB was configured as "x86_64-redhat-linux-gnu".
For bug reporting instructions, please see:
<http://www.gnu.org/software/gdb/bugs/>...
Reading symbols from /home/vagrant/clan/test/test...done.
## run 运行
(gdb) run
Starting program: /home/vagrant/clan/test/test
index = 0 index = 1 index = 2 index = 3 index = 4 index = 5 index = 6 index = 7 index = 8 index = 9
[Inferior 1 (process 12553) exited normally]
Missing separate debuginfos, use: debuginfo-install glibc-2.17-326.el7_9.x86_64
4.2 断点调试(在某一行)
1 在某一行打断点
格式:
## 简写 b filename:rownum
break filename:rownum
2 继续运行
## 简写 c
continue
输出变量的值
print varname
[root@chao_1 /home/vagrant/clan/test]$ gdb test
GNU gdb (GDB) Red Hat Enterprise Linux 7.6.1-120.el7
Copyright (C) 2013 Free Software Foundation, Inc.
License GPLv3+: GNU GPL version 3 or later <http://gnu.org/licenses/gpl.html>
This is free software: you are free to change and redistribute it.
There is NO WARRANTY, to the extent permitted by law.  Type "show copying"
and "show warranty" for details.
This GDB was configured as "x86_64-redhat-linux-gnu".
For bug reporting instructions, please see:
<http://www.gnu.org/software/gdb/bugs/>...
Reading symbols from /home/vagrant/clan/test/test...done.

## 1 加载可执行文件
(gdb) file test
Load new symbol table from "/home/vagrant/clan/test/test"? (y or n) y
Reading symbols from /home/vagrant/clan/test/test...done.

## 2 在test.c文件的第7行打断点
(gdb) b test.c:7
Breakpoint 1 at 0x40058e: file test.c, line 7.

## 3 运行程序
(gdb) r
Starting program: /home/vagrant/clan/test/test

Breakpoint 1, main () at test.c:7
7                        printf("index = %d ",index);
Missing separate debuginfos, use: debuginfo-install glibc-2.17-326.el7_9.x86_64


##4 输出变量的值
(gdb) print index
$1 = 0

##5 继续允许程序
(gdb) c
Continuing.

Breakpoint 1, main () at test.c:7
7                        printf("index = %d ",index);
(gdb) print index
$2 = 1
(gdb) c
Continuing.

Breakpoint 1, main () at test.c:7
7                        printf("index = %d ",index);
(gdb) print index
$3 = 2
4.3 断点调试(在函数入口处打断点)
格式
breakpoint file_name:function_name
调试样例
代码
#include
编译
g++ -g test.cpp -o test
函数断点调试
[vagrant@chao_1 /home/vagrant/clan/test]$ gdb test
GNU gdb (GDB) Red Hat Enterprise Linux 7.6.1-120.el7
Copyright (C) 2013 Free Software Foundation, Inc.
License GPLv3+: GNU GPL version 3 or later <http://gnu.org/licenses/gpl.html>
This is free software: you are free to change and redistribute it.
There is NO WARRANTY, to the extent permitted by law.  Type "show copying"
and "show warranty" for details.
This GDB was configured as "x86_64-redhat-linux-gnu".
For bug reporting instructions, please see:
<http://www.gnu.org/software/gdb/bugs/>...
Reading symbols from /home/vagrant/clan/test/test...done.
## 1 . 在函数入口处打断点

(gdb) b test.cpp:get_index
Breakpoint 1 at 0x400afe: file test.cpp, line 7.

## 2 运行程序
(gdb) r
Starting program: /home/vagrant/clan/test/test

Breakpoint 1, get_index (s1="abcgdb", s2="gdb") at test.cpp:7
7           if (&s1 == NULL || &s2 == NULL || s2.length() < 1 && s1.length() < s2.length())
Missing separate debuginfos, use: debuginfo-install glibc-2.17-326.el7_9.x86_64 libgcc-4.8.5-44.el7.x86_64 libstdc++-4.8.5-44.el7.x86_64

## 3 继续运行 直接跳过函数
(gdb) c
Continuing.
index = 3
[Inferior 1 (process 16728) exited normally]
查看断点
info breakpoints
(gdb) info breakpoints
Num     Type           Disp Enb Address            What
1       breakpoint     keep y   0x0000000000400afe in get_index(std::string const&, std::string const&) at test.cpp:7
        breakpoint already hit 1 time
(gdb)
5 调试core文件
5.1 生成core文件的方法
产生coredump的条件,首先需要确认当前会话的ulimit –c,若为0,则不会产生对应的coredump,需要进行修改和设置
ulimit -c
ulimit -c unlimited
更改core dump生成路径
## %e表示程序名, %p表示进程id
echo "/home/vagrant/core/core.%e.%p" > /proc/sys/kernel/core_pattern
5.2 调试core文件
测试代码
int main()
{
        char* str = "gdbcoretest";
        str[0] = 'G';
        return 0;
}
编译
g++ -g test.c -o test
运行
[vagrant@chao_1 /home/vagrant/clan/test]$ ./test
Segmentation fault (core dumped)
查看结果,出现了段错误
查看生成的core文件
[vagrant@chao_1 /home/vagrant/core]$ ll
total 300
-rw-------. 1 vagrant vagrant 245760 Nov 12 06:12 core.test.19727
-rw-------. 1 vagrant vagrant 245760 Nov 12 06:15 core.test.20012
调试core文件
## gdb 可执行文件名  core文件名
gdb test core.test.19727
/home/vagrant/clan/test]$ gdb test core.test.20379
GNU gdb (GDB) Red Hat Enterprise Linux 7.6.1-120.el7
Copyright (C) 2013 Free Software Foundation, Inc.
License GPLv3+: GNU GPL version 3 or later <http://gnu.org/licenses/gpl.html>
This is free software: you are free to change and redistribute it.
There is NO WARRANTY, to the extent permitted by law.  Type "show copying"
and "show warranty" for details.
This GDB was configured as "x86_64-redhat-linux-gnu".
For bug reporting instructions, please see:
<http://www.gnu.org/software/gdb/bugs/>...
Reading symbols from /home/vagrant/clan/test/test...done.
[New LWP 20379]
Core was generated by `./test'.
Program terminated with signal 11, Segmentation fault.
#0  0x00000000004004fd in main () at testCore.c:5
5               str[0] = 'G';
Missing separate debuginfos, use: debuginfo-install glibc-2.17-326.el7_9.x86_64
## 查看函数的栈帧 testCore.c 第5行出现了段错误
## 使用 where 也可以
(gdb) bt
#0  0x00000000004004fd in main () at testCore.c:5

(gdb) where
#0  0x00000000004004fd in main () at testCore.c:5