语音特征提取与预处理
导入相关包
import librosa
import librosa.display
import soundfile as sf
import numpy as np
import matplotlib.pyplot as plt
from playsound import playsound
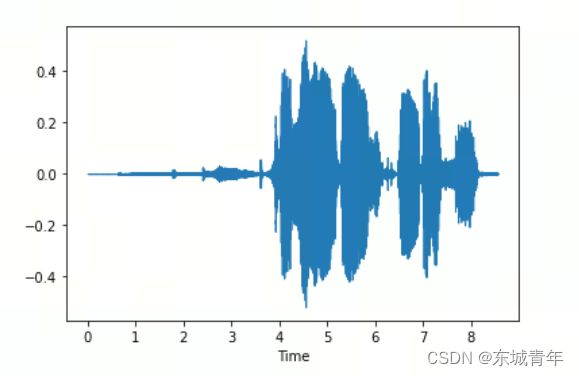
语音读取与显示
file_path = 'test1.wav'
data, fs = librosa.load(file_path, sr=None, mono=True)
librosa.display.waveshow(data)
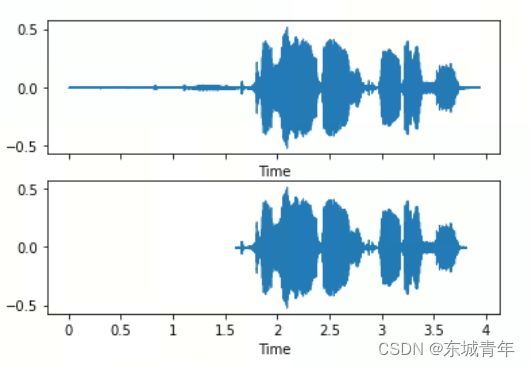
端点检测(去除前后静音段)
原理:将每帧均方根能量与全局最大均方根能量进行比较。
y, fs = librosa.load(file_path, sr=16000)
yt, index = librosa.effects.trim(y, top_db=30)

fig, axis = plt.subplots(nrows=2, ncols=1, sharex=True, sharey=True)
librosa.display.waveshow(y, sr=fs, ax=axis[0])
librosa.display.waveshow(yt, sr=fs, ax=axis[1], offset=index[0] / fs)

sf.write('test_trim.wav', yt, fs)
playsound('test1.wav')
playsound('test_trim.wav')
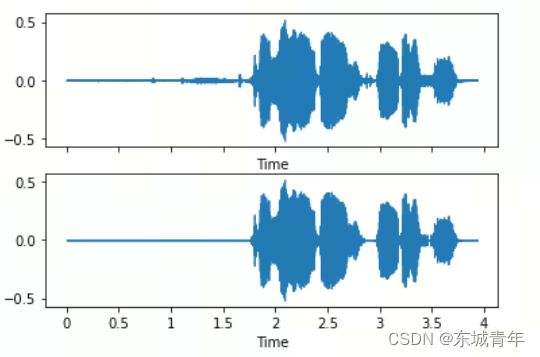
端点检测(包含语音内部)
y, fs = librosa.load(file_path, sr=16000)
intervals = librosa.effects.split(y, top_db=20)
fig, axis = plt.subplots(2, 1, sharex=True, sharey=True)

librosa.display.waveshow(y, sr=fs, ax=axis[0])
y_dst = np.zeros_like(y)
for i in range(len(intervals)):
    y_dst[intervals[i][0] : intervals[i][1]] =  y[intervals[i][0] : intervals[i][1]]
librosa.display.waveshow(y_dst, sr=fs, ax=axis[1])

# y_remix = librosa.effects.remix(y, intervals)
# librosa.display.waveshow(y_remix, sr=fs, ax=axis[1], offset=intervals[0][0] / fs)
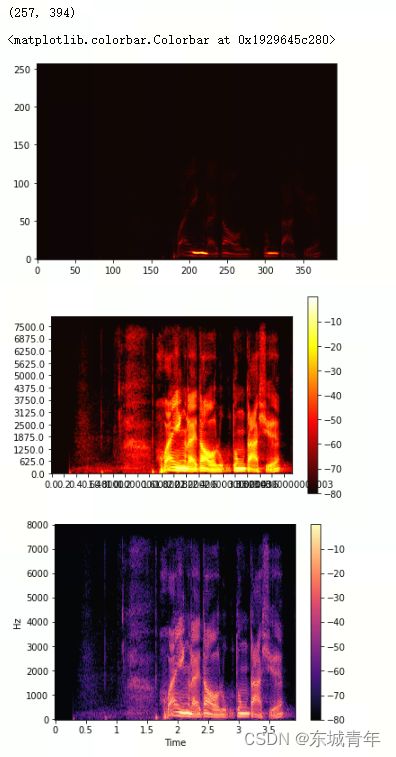
频域分析
y, fs = librosa.load('test1.wav', sr = 16000)
frame_t = 25 # 25ms帧长
hop_length_t = 10 # 10ms步进

win_length = int(frame_t * fs / 1000)
hop_length = int(hop_length_t * fs / 1000)
n_fft = int(2**np.ceil(np.log2(win_length)))

S = np.abs(librosa.stft(y, n_fft=n_fft, hop_length=hop_length, win_length=win_length))
print(S.shape)

# 直接显示
fig = plt.figure(1)
plt.imshow(S, origin='lower', cmap='hot') # 由于fft结果较大的值集中在低频部分所以显示并不明显

# 自己写程序实现
S = librosa.amplitude_to_db(S, ref=np.max)
D, N = S.shape
range_D = np.arange(0, D, 20)
range_N = np.arange(0, N, 20)
range_f = range_D * (fs / n_fft)
range_t = range_N * (hop_length / fs)
fig = plt.figure(2)
plt.xticks(range_N, range_t)
plt.yticks(range_D, range_f)
plt.imshow(S, origin='lower', cmap='hot')
plt.colorbar()

# 调用内置显示程序
fig = plt.figure(3)
librosa.display.specshow(S, y_axis='linear', x_axis='time', hop_length=hop_length, sr=fs)
plt.colorbar()
预加重
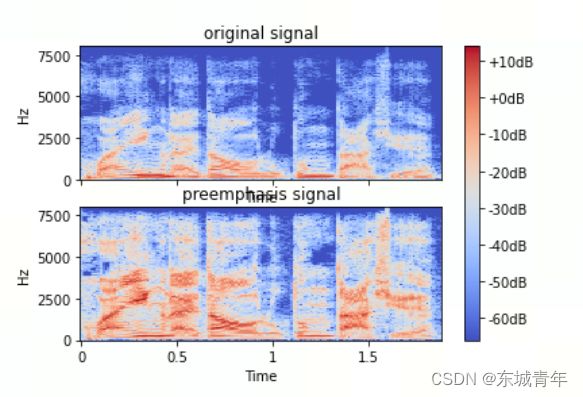
高通滤波,弥补高频部分的损耗,保护了声道信息:y[n] -> y[n] - coef * y[n-1]。
y, fs = librosa.load('test_split.wav', sr = None)
win_length = 512
hop_length = 160
n_fft = 512

S = librosa.stft(y, n_fft=n_fft, hop_length = hop_length, win_length=win_length)
S = librosa.amplitude_to_db(np.abs(S))

y_filt = librosa.effects.preemphasis(y)
sf.write('test_split_preemphasis.wav', y_filt, fs)
S_preemp = librosa.stft(y_filt, n_fft=n_fft, hop_length = hop_length, win_length=win_length)
S_preemp = librosa.amplitude_to_db(np.abs(S_preemp))

fig, axis = plt.subplots(2, 1, sharex=True, sharey=True)
librosa.display.specshow(S, sr=fs, hop_length=hop_length, y_axis='linear', x_axis='time', ax=axis[0])
axis[0].set(title='original signal')

img = librosa.display.specshow(S_preemp, sr=fs, hop_length=hop_length, y_axis='linear', x_axis='time', ax=axis[1])
axis[1].set(title='preemphasis signal')

plt.colorbar(img, ax=axis, format="%+2.fdB")
Filter Bank:梅尔谱特征
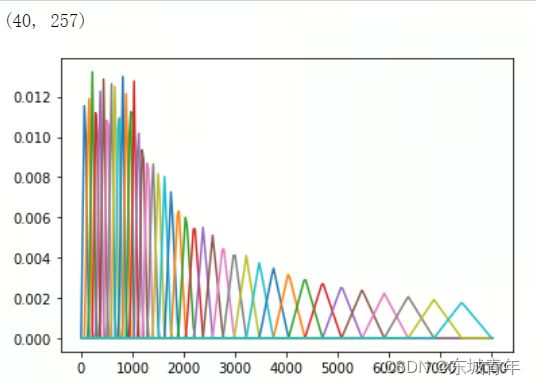
梅尔滤波器:
y, fs = librosa.load('test_split.wav', sr = None)
win_length = 512
hop_length = 160
n_fft = 512
n_mels = 40

# 梅尔滤波器组
melfb = librosa.filters.mel(sr=fs, n_fft=n_fft, n_mels=n_mels)
print(melfb.shape)

x = np.arange(melfb.shape[1]) * fs / n_fft
plt.plot(x, melfb.T)
plt.show()
梅尔谱:
S = np.abs(librosa.stft(y, n_fft=n_fft, hop_length = hop_length, win_length=win_length))
print(S.shape)
fbank = melfb.dot(S)
print(fbank.shape)
print(fbank)

#内置函数
fbank = librosa.feature.melspectrogram(y=y, sr=fs, n_fft=n_fft, win_length=win_length, hop_length=hop_length, n_mels=n_mels)
print(fbank.shape)
print(fbank)

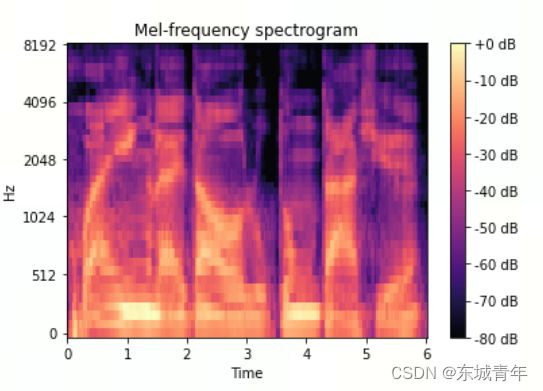
fig = plt.figure()
fbank_db = librosa.power_to_db(fbank, ref=np.max)
img = librosa.display.specshow(fbank_db, x_axis='time', y_axis='mel', sr=fs, fmax=fs/2)
fig.colorbar(img, format='%+2.0f dB')
plt.title('Mel-frequency spectrogram')
MFCC特征
y, fs = librosa.load('test1.wav', sr=16000)
win_length = 512
hop_length = 160
n_fft = 512
n_mels = 128
n_mfcc = 20
mfcc = librosa.feature.mfcc(y=y,
                           sr=fs,
                           win_length=win_length,
                           hop_length=hop_length,
                           n_fft=n_fft,
                           n_mels=n_mels,
                           dct_type=1)
# 特征值增加差分量
# 一阶差分
mfcc_deta = librosa.feature.delta(mfcc)
# 二阶差分
mfcc_deta2 = librosa.feature.delta(mfcc, order=2)
# 特征拼接
mfcc_d1_d2 = np.concatenate([mfcc, mfcc_deta, mfcc_deta2], axis=0)

# 频谱显示
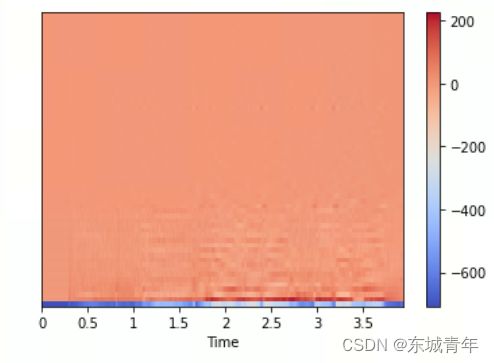
fig = plt.figure()
img = librosa.display.specshow(mfcc_d1_d2, x_axis='time', hop_length=hop_length, sr=fs)
fig.colorbar(img)
plt.show()
参考语音特征提取与预处理_哔哩哔哩_bilibili
资料及源码:SpeechProcessing: 语音处理 - Gitee.com
