QIIME 2 使用总结
软件介绍
这是一个关于该软件的overview
https://docs.qiime2.org/2020.11/tutorials/overview/
下载安装
如果没有conda环境,需要先安装conda
安装教程:https://docs.qiime2.org/2020.11/install/native/#install-qiime-2-within-a-conda-environment
wget https://data.qiime2.org/distro/core/qiime2-2020.11-py36-linux-conda.yml
conda env create -n qiime2-2020.11 --file qiime2-2020.11-py36-linux-conda.yml
# OPTIONAL CLEANUP
rm qiime2-2020.11-py36-linux-conda.yml
数据输入输出
QIIME 2 中数据都需要导入成artifacts格式
导入方法:
https://docs.qiime2.org/2020.11/tutorials/importing/#sequence-data-with-sequence-quality-information-i-e-fastq
如fastq的导入有以下几种方式
With QIIME 2, there are functions to import different types of FASTQ data:
- FASTQ data with the EMP Protocol format
- Multiplexed FASTQ data with
barcodes in sequences - FASTQ data in the Casava 1.8 demultiplexed
format - Any FASTQ data not represented in the list items above
由于我们的数据从ncbi上面下载,SRA后缀的文件,用fastq-dump命令之后得到的是一个fastq文件,没有其他的辅助文件,导入方法见移步此博客。
导入时,除了原始序列的fastq文件,还需要其他的文件
Casava 1.8 single-end demultiplexed fastq
导出方法
直接导出即可
https://docs.qiime2.org/2020.11/tutorials/exporting/
mkdir extracted-feature-table
qiime tools extract \
  --input-path feature-table.qza \
  --output-path extracted-feature-table
artifact/visualization files .qza/.qzv files
In order to use QIIME 2, your input data must be stored in QIIME 2 artifacts (i.e. .qza files).
visualization files 可以看见图标
artifacts type
https://docs.qiime2.org/2020.11/semantic-types/
这里列出几种和OTU相关的type
FeatureTable[Frequency]: A feature table (e.g., samples by OTUs) where each value indicates the frequency of an OTU in the corresponding sample expressed as raw counts.
FeatureTable[RelativeFrequency]: A feature table (e.g., samples by
OTUs) where each value indicates the relative abundance of an OTU in
the corresponding sample such that the values for each sample will sum
to 1.0.FeatureTable[PresenceAbsence]: a feature table (e.g., samples by OTUs)
where each value indicates whether an OTU is present or absent in the
corresponding sample.FeatureTable[Composition]: A feature table (e.g., samples by OTUs)
where each value indicates the frequency of an OTU in the
corresponding sample, and all frequencies are greater than zero.
使用
激活工作环境
conda activate qiime2-2020.11
关闭工作环境
source deactivate
可视化
此时 fmt-tutorial-demux-1.qza 的 type是
SampleData[SequencesWithQuality]
qiime demux summarize \
  --i-data fmt-tutorial-demux-1.qza \
  --o-visualization demux-summary-1.qzv
qiime demux summarize \
  --i-data fmt-tutorial-demux-2.qza \
  --o-visualization demux-summary-2.qzv
质量控制 DADA2
qiime dada2 denoise-single \
  --p-trim-left 13 \
  --p-trunc-len 150 \
  --i-demultiplexed-seqs fmt-tutorial-demux-1.qza \
  --o-representative-sequences rep-seqs-1.qza \
  --o-table table-1.qza \
  --o-denoising-stats stats-1.qza
qiime dada2 denoise-single \
  --p-trim-left 13 \
  --p-trunc-len 150 \
  --i-demultiplexed-seqs fmt-tutorial-demux-2.qza \
  --o-representative-sequences rep-seqs-2.qza \
  --o-table table-2.qza \
  --o-denoising-stats stats-2.qza
生成文件的type
stats-1.qza SampleData[DADA2Stats]
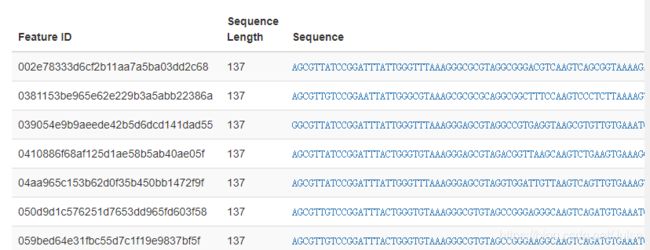
rep-seqs-1.qza FeatureData[Sequence]
format:“DNASequencesDirectoryFormat”table-1.qza BIOMV210DirFmt
rep-seqs.qzv 可视化

这个文件导出之后是一个后缀为.biom的文件,可以通过biom相关工具包转换为csv
可以完成的功能
Differential abundance measurements determine which features (OTUs, ASVs, taxa, etc) are significantly more/less abundant in different experimental groups.


