机器学习算法之决策树回归模型可视化
一个程序员在海滨游泳时溺水身亡。他死前拼命的呼救,当时海滩上有许多救生员,但是没有人救他。因为他一直大喊“F1!”“F1!”,谁都不知道“F1”究竟是什么意思。

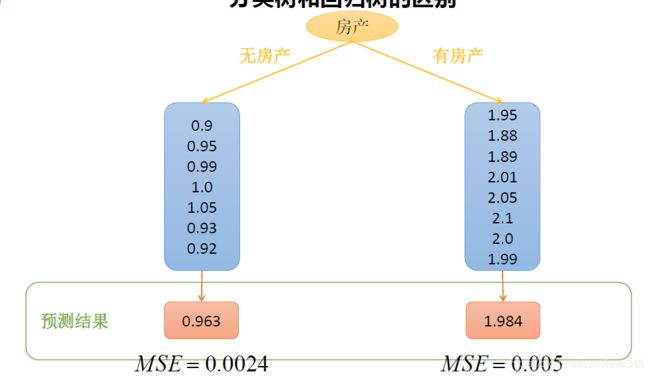
分类树和回归树的区别


import numpy as np
import matplotlib as mpl
import matplotlib.pyplot as plt
import pandas as pd
import warnings
import sklearn
from sklearn.linear_model import LinearRegression, LassoCV, RidgeCV
from sklearn.pipeline import Pipeline
from sklearn.model_selection  import train_test_split
from sklearn.model_selection import GridSearchCV
from sklearn.tree import DecisionTreeRegressor
from sklearn.pipeline import Pipeline
from sklearn.feature_selection import SelectKBest
from sklearn.feature_selection import chi2
from sklearn.preprocessing import MinMaxScaler
from sklearn.decomposition import PCA
from sklearn.pipeline import Pipeline
from sklearn.model_selection  import GridSearchCV
from sklearn.linear_model.coordinate_descent import ConvergenceWarning
def notEmpty(s):
    return s != ''
mpl.rcParams['font.sans-serif']=[u'simHei']
mpl.rcParams['axes.unicode_minus']=False
## 拦截异常
warnings.filterwarnings(action = 'ignore', category=ConvergenceWarning)
names = ['CRIM','ZN', 'INDUS','CHAS','NOX','RM','AGE','DIS','RAD','TAX','PTRATIO','B','LSTAT']
path = "datas/boston_housing.data"
## 由于数据文件格式不统一,所以读取的时候,先按照一行一个字段属性读取数据,然后再按照每行数据进行处理
fd = pd.read_csv(path, header=None)
data = np.empty((len(fd), 14))
for i, d in enumerate(fd.values):
    d = map(float, filter(notEmpty, d[0].split(' ')))
    data[i] = list(d)

x, y = np.split(data, (13,), axis=1)
y = y.ravel()

print ("样本数据量:%d, 特征个数:%d" % x.shape)
print ("target样本数据量:%d" % y.shape[0])
样本数据量:506, 特征个数:13
target样本数据量:506
#数据的分割,
x_train1, x_test1, y_train1, y_test1 = train_test_split(x, y, train_size=0.8, random_state=14)
x_train, x_test, y_train, y_test = x_train1, x_test1, y_train1, y_test1
print ("训练数据集样本数目:%d, 测试数据集样本数目:%d" % (x_train.shape[0], x_test.shape[0]))
训练数据集样本数目:404, 测试数据集样本数目:102
#标准化
ss = MinMaxScaler()

x_train = ss.fit_transform(x_train, y_train)
x_test = ss.transform(x_test)

print ("原始数据各个特征属性的调整最小值:",ss.min_)
print ("原始数据各个特征属性的缩放数据值:",ss.scale_)
原始数据各个特征属性的调整最小值: [-7.10352762e-05 0.00000000e+00 -1.68621701e-02 0.00000000e+00
-7.92181070e-01 -6.82314620e-01 -2.98661174e-02 -1.02719857e-01
-4.34782609e-02 -3.56870229e-01 -1.34042553e+00 -6.38977636e-03
-4.90780142e-02]
原始数据各个特征属性的缩放数据值: [1.12397589e-02 1.00000000e-02 3.66568915e-02 1.00000000e+00
2.05761317e+00 1.91607588e-01 1.02986612e-02 9.09347180e-02
4.34782609e-02 1.90839695e-03 1.06382979e-01 2.53562554e-03
2.83687943e-02]
#构建模型(回归)
model = DecisionTreeRegressor(criterion='mae',max_depth=5)
#模型训练
model.fit(x_train, y_train)
#模型预测
y_test_hat = model.predict(x_test)
#评估模型
score = model.score(x_test, y_test)
print ("Score:", score)
Score: 0.7900379894156064
# 方式三:直接生成图片
from sklearn import tree
from IPython.display import Image
import pydotplus
dot_data = tree.export_graphviz(model, out_file=None,
                         filled=True, rounded=True,
                         special_characters=True)
graph = pydotplus.graph_from_dot_data(dot_data)
Image(graph.create_png())
