详细讲解processing绘制不同折线图或心电图
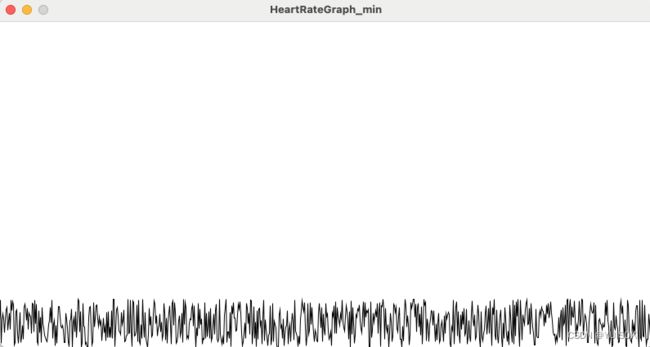
float[] ecgData;
int currentIndex = 0; //初始化我们的x坐标从0开始

void setup() {
  size(800, 400); //设置画面尺寸
  background(255); //背景整成白的
  ecgData = new float[width];  //新建一个数组,大小为宽度这么大,放自己y坐标
}

void draw() {
  background(255); //需要背景刷新,不然每一次的曲线都会叠加,你注释这句就可以看出来效果

  float newData = random(60); //这里是给y坐标要赋值了,我是给了不超过60的随机值
  ecgData[currentIndex] = newData;  //从x坐标为0开始给y赋值
  currentIndex = (currentIndex + 1) % width; //为了滚动实现,我们x坐标超过宽度最大值就再从0开始继续一次次增加1

  stroke(0); //绘制线条的颜色
  noFill();  //不填充,因为是线条
  beginShape();  //和endShape()一对,中间就是曲线的连接,思路就是把x,y坐标进行连接
  for (int i = 0; i < width; i++) { //从0到宽度大小的给x,y进行赋值
    float x = i;
    float y = height - ecgData[(currentIndex + i) % width];//这个用高度减了一下,因为画布的起始是从左上角开始的,不然这个心电图就在上面了
    vertex(x, y);//连接坐标点
  }
  endShape();
}
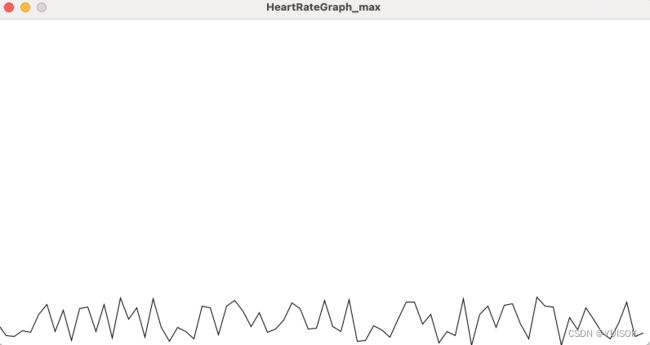
如果想让它稍微宽一点:
float[] ecgData;
int currentIndex = 0;
float pointSpacing = 10; //思路就是让x坐标每次加pointSpacing宽一点

void setup() {
  size(800, 400);
  background(255);
  ecgData = new float[width / 10]; //x坐标宽了,那数组大小得小一点,不然超了
}

void draw() {
  background(255);

  float newData = random(60);
  ecgData[currentIndex] = newData;
  currentIndex = (currentIndex + 1) % ecgData.length;

  stroke(0);
  noFill();
  beginShape();
  for (int i = 0; i < ecgData.length; i++) {
    float x = i * pointSpacing; //思路就是让x坐标每次加pointSpacing宽一点
    float y = height - ecgData[(currentIndex + i) % ecgData.length];
    vertex(x, y);
  }
  endShape();
}

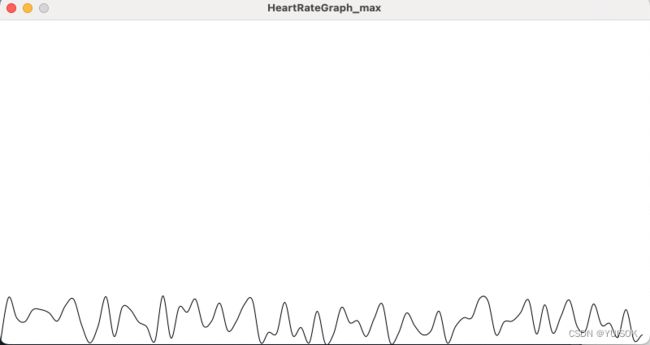
宽是宽了,但是不够圆润:
把vertex(x, y);换成curveVertex(x,y);
curveVertex()函数会根据前后的数据点自动计算出中间的控制点,从而创建平滑的曲线。
float[] ecgData;
int currentIndex = 0;
float pointSpacing = 10;

void setup() {
  size(800, 400);
  background(255);
  ecgData = new float[width / 10];
}

void draw() {
  background(255);

  float newData = random(60);
  ecgData[currentIndex] = newData;
  currentIndex = (currentIndex + 1) % ecgData.length;

  stroke(0);
  noFill();
  beginShape();
  for (int i = 0; i < ecgData.length; i++) {
    float x = i * pointSpacing;
    float y = height - ecgData[(currentIndex + i) % ecgData.length];
    curveVertex(x, y);
  }
  endShape();
}

