机器学习:matlab实现异常检测
文章目录
- 原理
- 主要函数
-
- 求出正态分布参数
- 选择阈值
- 计算概率值
- 实例
-
- 寻找二维样本中的异常点
- 高维应用
原理
原理在此,主要是概率论的东西。
主要函数
求出正态分布参数
这里没有用多元正态分布,因为从数据集上感觉两个变量相关性并不是很强:

所以我们直接对数据的特征值维度分别求均值和方差即可:
function [mu sigma2] = estimateGaussian(X)
%ESTIMATEGAUSSIAN This function estimates the parameters of a
%Gaussian distribution using the data in X
%   [mu sigma2] = estimateGaussian(X),
%   The input X is the dataset with each n-dimensional data point in one row
%   The output is an n-dimensional vector mu, the mean of the data set
%   and the variances sigma^2, an n x 1 vector
%

% Useful variables
[m, n] = size(X);

% You should return these values correctly
mu = zeros(n, 1);
sigma2 = zeros(n, 1);

% ====================== YOUR CODE HERE ======================
% Instructions: Compute the mean of the data and the variances
%               In particular, mu(i) should contain the mean of
%               the data for the i-th feature and sigma2(i)
%               should contain variance of the i-th feature.
%

mu=mean(X);
sigma2=mean((X-mu).^2);


% =============================================================


end
之所以没有用var函数是因为matlab的var除的是 m − 1 m-1 m−1,而最大似然估计除的是 m m m(虽然在 m m m很大的时候并没有多大影响)。
选择阈值
建立了模型以后,我们还需要选择一个阈值 ε \varepsilon ε,当 f ( x ⃗ ∣ μ ⃗ , σ 2 ⃗ ) < ε f(\vec{x}|\vec{\mu},\vec{\sigma^2})<\varepsilon f(x∣μ,σ2)<ε时我们就认为其是一个异常点。为了找到一个合适的值,我们在验证集上进行预测,算出 f ( x ⃗ ∣ μ ⃗ , σ 2 ⃗ ) f(\vec{x}|\vec{\mu},\vec{\sigma^2}) f(x∣μ,σ2)值,然后遍历一系列 ε \varepsilon ε值,对于每个 ε \varepsilon ε计算其真阳性、假阳性、假阴性的个数,以此计算查准率和召回率,最后用 F 1 F_1 F1值来衡量 ε \varepsilon ε的好坏。
不得不说matlab的向量计算做的是真的好,完全没有for循环的必要,直接就能求出真阳性、假阳性、假阴性个数。
function [bestEpsilon bestF1] = selectThreshold(yval, pval)
%SELECTTHRESHOLD Find the best threshold (epsilon) to use for selecting
%outliers
%   [bestEpsilon bestF1] = SELECTTHRESHOLD(yval, pval) finds the best
%   threshold to use for selecting outliers based on the results from a
%   validation set (pval) and the ground truth (yval).
%

bestEpsilon = 0;
bestF1 = 0;
F1 = 0;

stepsize = (max(pval) - min(pval)) / 1000;
for epsilon = min(pval):stepsize:max(pval)

    % ====================== YOUR CODE HERE ======================
    % Instructions: Compute the F1 score of choosing epsilon as the
    %               threshold and place the value in F1. The code at the
    %               end of the loop will compare the F1 score for this
    %               choice of epsilon and set it to be the best epsilon if
    %               it is better than the current choice of epsilon.
    %
    % Note: You can use predictions = (pval < epsilon) to get a binary vector
    %       of 0's and 1's of the outlier predictions

    tp=sum((pvalepsilon)&(yval==1));
    fn=sum((pval bestF1
       bestF1 = F1;
       bestEpsilon = epsilon;
    end
end

end
计算概率值
利用得到的参数计算样本点出现的概率,吴恩达写的,看起来就很高级:
function p = multivariateGaussian(X, mu, Sigma2)
%MULTIVARIATEGAUSSIAN Computes the probability density function of the
%multivariate gaussian distribution.
%    p = MULTIVARIATEGAUSSIAN(X, mu, Sigma2) Computes the probability
%    density function of the examples X under the multivariate gaussian
%    distribution with parameters mu and Sigma2. If Sigma2 is a matrix, it is
%    treated as the covariance matrix. If Sigma2 is a vector, it is treated
%    as the \sigma^2 values of the variances in each dimension (a diagonal
%    covariance matrix)
%

k = length(mu);

if (size(Sigma2, 2) == 1) || (size(Sigma2, 1) == 1)
    Sigma2 = diag(Sigma2);
end

X = bsxfun(@minus, X, mu(:)');
p = (2 * pi) ^ (- k / 2) * det(Sigma2) ^ (-0.5) * ...
    exp(-0.5 * sum(bsxfun(@times, X * pinv(Sigma2), X), 2));

end
实例
寻找二维样本中的异常点
数据集在上面已经看到过了,为
% The following command loads the dataset. You should now have the variables X, Xval, yval in your environment
load('ex8data1.mat');

% Visualize the example dataset
plot(X(:, 1), X(:, 2), 'bx');
axis([0 30 0 30]);
xlabel('Latency (ms)');
ylabel('Throughput (mb/s)');

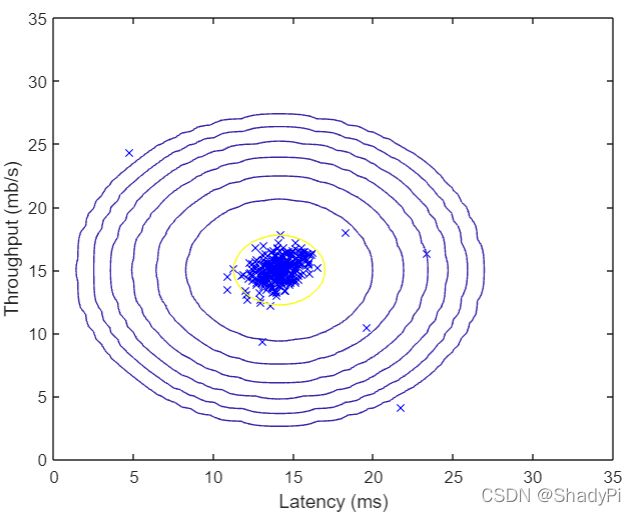
找到参数以后,我们可以把二维的高斯分布图像绘制出来,看看模型长啥样:
%  Estimate mu and sigma2
[mu, sigma2] = estimateGaussian(X);

%  Returns the density of the multivariate normal at each data point (row) of X
p = multivariateGaussian(X, mu, sigma2);

%  Visualize the fit
visualizeFit(X,  mu, sigma2);
xlabel('Latency (ms)');
ylabel('Throughput (mb/s)');

之后加载验证集,在验证集上寻找一个最佳的 ε \varepsilon ε值,用这个 ε \varepsilon ε值就可以找到训练集中的异常样本:
pval = multivariateGaussian(Xval, mu, sigma2);

[epsilon, F1] = selectThreshold(yval, pval);
fprintf('Best epsilon found using cross-validation: %e\n', epsilon);
fprintf('Best F1 on Cross Validation Set:  %f\n', F1);

%  Find the outliers in the training set and plot the
outliers = find(p < epsilon);

%  Visualize the fit
visualizeFit(X,  mu, sigma2);
xlabel('Latency (ms)');
ylabel('Throughput (mb/s)');
%  Draw a red circle around those outliers
hold on
plot(X(outliers, 1), X(outliers, 2), 'ro', 'LineWidth', 2, 'MarkerSize', 10);
hold off
高维应用
在更高维度其实是一样的,因为我们函数很好的兼容了高维向量,二维或者高维没什么区别。
%  Loads the second dataset. You should now have the variables X, Xval, yval in your environment
load('ex8data2.mat');

%  Apply the same steps to the larger dataset
[mu, sigma2] = estimateGaussian(X);

%  Training set
p = multivariateGaussian(X, mu, sigma2);

%  Cross-validation set
pval = multivariateGaussian(Xval, mu, sigma2);

%  Find the best threshold
[epsilon, F1] = selectThreshold(yval, pval);
fprintf('Best epsilon found using cross-validation: %e\n', epsilon);
fprintf('Best F1 on Cross Validation Set:  %f\n', F1);
fprintf('# Outliers found: %d\n', sum(p < epsilon));

