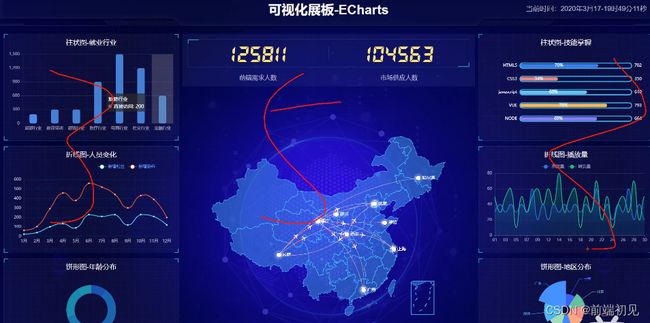
ECharts数据可视化项目-大屏数据可视化【持续更新中】
ECharts数据可视化项目-大屏数据可视化【持续更新中】
文章目录
- ECharts数据可视化项目-大屏数据可视化【持续更新中】
-
- 一、 数据可视化ECharts使用
- 二、技术栈
- 三、数据可视化
- 四、可视化适配方案
-
-
- 1.使用技术:
- 2.项目准备初始化:
- 3.案例适配方案:
- 4.基础设置:
- 5.可视化项目头部制作:
- 6.mainbox布局分析:
- 7.公共面板模块 panel:
- 8.panel盒子完成(图表模块布局):
- 9.数字模块no布局制作:
- 10.数字模块no-hd布局制作:
- 11.数字模块no-bd布局制作:
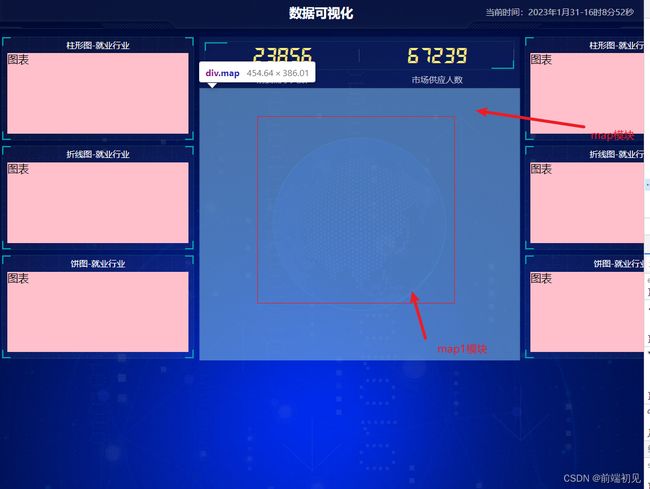
- 12.地图模块(map)布局制作:
-
- map1球体模块制作
- 旋转盒子1(map2)*
- 旋转箭头盒子2(map3)
- 地图模块(chart)
- 页面布局完成
-
- 五、Echarts开源可视化图表库
-
-
- 1.常见的数据可视化库:
- 2.Echarts 简介
- 2.Echarts体验使用:
-
- 步骤1:下载并引入echarts.js文件
- 步骤2:准备一个具备大小的DOM容器
- 步骤3:初始化echarts实例对象
- 步骤4:指定配置项和数据option
- 步骤5:将配置项设置给echarts实例对象
- 2.Echarts基础配置:
-
- 总结
-
- ==**持续更新中**==
一、 数据可视化ECharts使用
- 可视化面板布局适配屏幕
- 利用ECharts实现展示
二、技术栈
- 基于flexible.js+rem智能大屏适配
- VScode cssrem插件
- Flex布局
- Less使用
- 基于Ecarts数据可视化展示
- Echarts柱状图数据设置
- Echarts地图引入
三、数据可视化
四、可视化适配方案
应对现在数据可视化的趋势,越来越多企业需要在很多场景(营销数据,生产数据,用户数据)下使用,可视化图表来展示体现数据,让数据更加直观,数据特点更加突出。
1.使用技术:
- div+css布局
- flex布局
- Less
- 原生js+jquery使用
- rem适配
- echarts基础
2.项目准备初始化:
- index.html首页文件
- css文件夹
- js文件夹
- font图标字体文件夹
- images图片文件夹

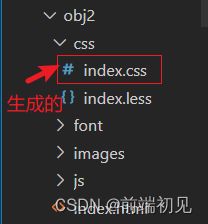
下载插件(Easy LESS)

此插件会将我们写的less文件生成一份css文件,在index.html引入css文件即可

3.案例适配方案:
- 设计稿是1920px
- flexible.js把屏幕分为24等份
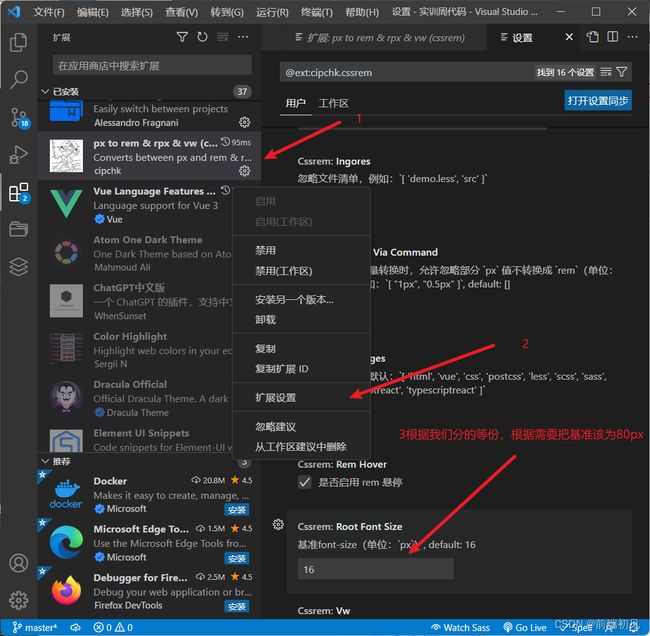
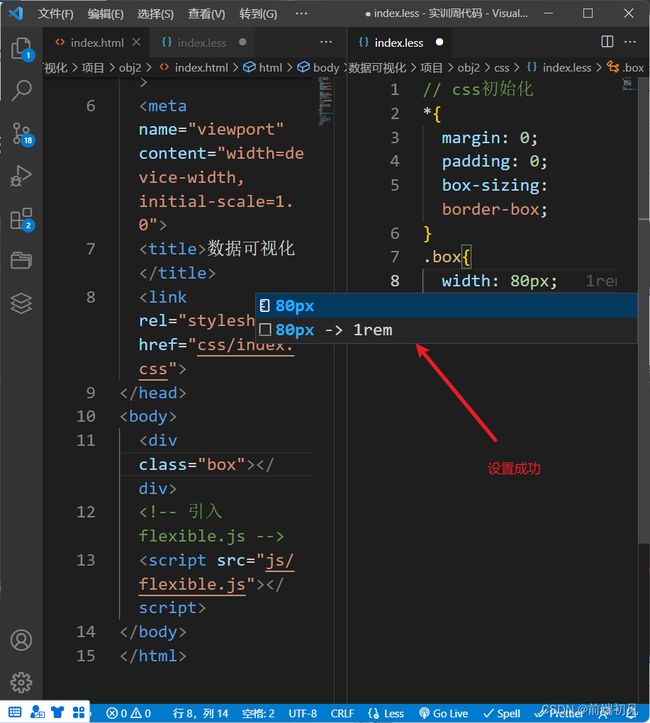
- cssrem插件的基准值是80px,插件-配置按钮-配置扩展设置-Root Font Size里面设置。但是你别忘记重启vscode软件保证生效
引入flexible.js
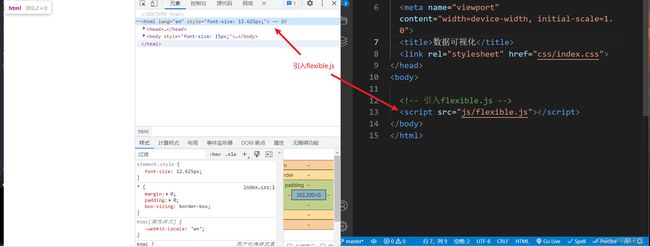
▼flexible.js源码(可以直接新建一个js文件,复制粘贴过去,也可以私信我要源代码)
(function flexible(window, document) {
  var docEl = document.documentElement;
  var dpr = window.devicePixelRatio || 1;
  // adjust body font size
  function setBodyFontSize() {
    if (document.body) {
      document.body.style.fontSize = 12 * dpr + "px";
    } else {      document.addEventListener("DOMContentLoaded", setBodyFontSize);
    }
  }
  setBodyFontSize();
  // set 1rem = viewWidth / 10
  function setRemUnit() {
    var rem = docEl.clientWidth / 24;
    //划分的等份,可以根据自己的需求进行更改
    docEl.style.fontSize = rem + "px";
  }
  setRemUnit();
  // reset rem unit on page resize
  window.addEventListener("resize", setRemUnit);
  window.addEventListener("pageshow", function(e) {
    if (e.persisted) {
      setRemUnit();
    }
  });

  // detect 0.5px supports
  if (dpr >= 2) {
    var fakeBody = document.createElement("body");
    var testElement = document.createElement("div");
    testElement.style.border = ".5px solid transparent";
    fakeBody.appendChild(testElement);
    docEl.appendChild(fakeBody);
    if (testElement.offsetHeight === 1) {
      docEl.classList.add("hairlines");
    }
    docEl.removeChild(fakeBody);
  }
})(window, document);
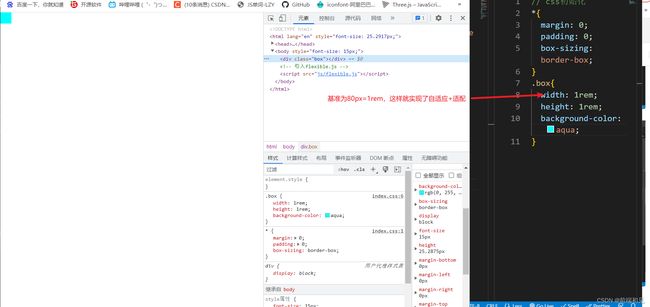
▲上方手动设置分成24等份,设计稿是1920px,每一份就是80px
下载插件(px to rem & rpx & vw (cssrem))
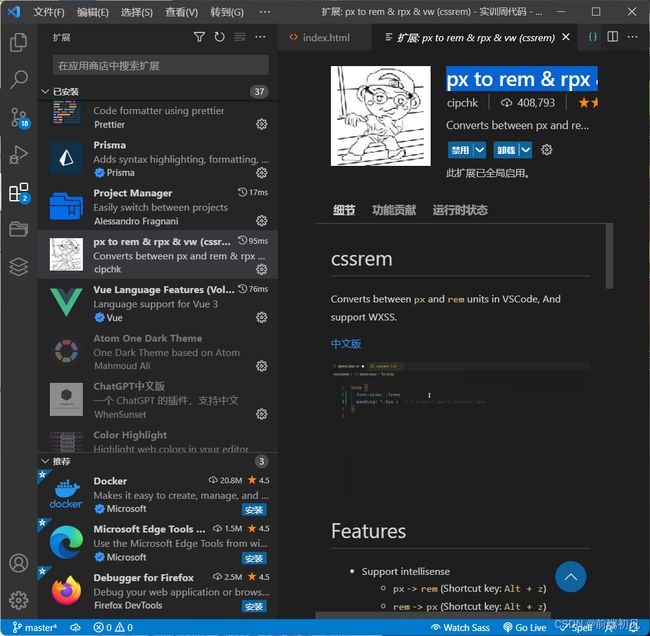
下载好,根据需要进行基准设置,这样可以更好的帮助我们进行设计
4.基础设置:
- body设置背景图,缩放为100%,行高1.15
- css初始化
基础设置css代码
// css初始化
*{
  margin: 0;
  padding: 0;
  box-sizing: border-box;
}
// 基础设置
body{
  //body 设置背景图,缩放为 100% ,行高1.15
  background: url(../images//bg.jpg) no-repeat top center;
  line-height: 1.15;
}
body背景图(可以右键下载,也可私我要全部素材和源码)

基础设置完成(效果图)
5.可视化项目头部制作:
UI图
![]()
header布局:
- 高度为100px
- header背景图,在容器内显示
- 缩放比例为100%
- h1标题部分 白色 38像素 居中显示 行高为80像素
- 时间模块 showTiime 定位右侧 right为30px 行高为75px 文字颜色为rgba(255,255,255,0.7) 而文字大小为20像素
header布局html代码
DOCTYPE html>
<html lang="en">
<head>
  <meta charset="UTF-8">
  <meta http-equiv="X-UA-Compatible" content="IE=edge">
  <meta name="viewport" content="width=device-width, initial-scale=1.0">
  <title>数据可视化title>
  <link rel="stylesheet" href="css/index.css">
head>
<body>

  <header>
    <h1>数据可视化h1>
    <div class="showTime">111div>
  header>

  <script src="js/flexible.js">script>

  <script src="js/showTime.js">script>
body>
html>
header布局less代码
// css初始化
*{
  margin: 0;
  padding: 0;
  box-sizing: border-box;
}
// 基础设置
body{
  //body 设置背景图,缩放为 100% ,行高1.15
  background: url(../images//bg.jpg) no-repeat top center;
  line-height: 1.15;
}
// header 布局
header{
  position: relative;
  // 高度为100px
  height: 1.25rem;
  // 背景图,在容器内显示 缩放比例为 100%
  background: url(../images/head_bg.png) no-repeat;
  background-size: 100% 100%;
  h1{
    // h1 标题部分 白色 38像素 居中显示 行高为 80像素
    font-size: .475rem;
    color: white;
    text-align: center;
    line-height: 1rem;
  }
  .showTime{
    // 时间模块 showTime 定位右侧 right 为 30px 行高为 75px 文字颜色为:rgba(255, 255, 255, 0.7) 而文字大小为 20像素
    position: absolute;
    right: .375rem;
    top: 0;
    line-height: .9375rem;
   color:rgba(255, 255, 255, 0.7);
    font-size: .25rem;
  }
}
header布局js代码
 格式: 当前时间:2020年3月17-0时54分14秒
var t = null;
t = setTimeout(time, 1000);//開始运行
function time() {
    clearTimeout(t);//清除定时器
    dt = new Date();
    var y = dt.getFullYear();
    var mt = dt.getMonth() + 1;
    var day = dt.getDate();
    var h = dt.getHours();//获取时
    var m = dt.getMinutes();//获取分
    var s = dt.getSeconds();//获取秒
    document.querySelector(".showTime").innerHTML = '当前时间:' + y + "年" + mt + "月" + day + "-" + h + "时" + m + "分" + s + "秒";
    t = setTimeout(time, 1000); //设定定时器,循环运行
}
6.mainbox布局分析:
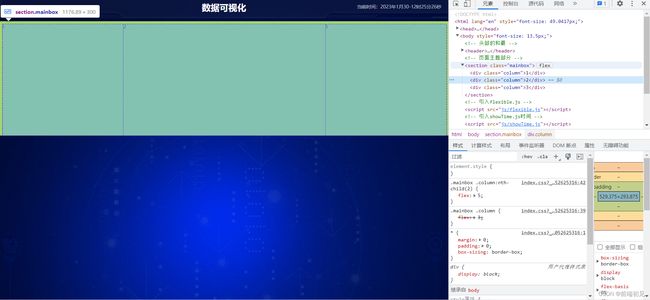
mainbox 主体模块布局:
- 需要一个上左右10px的内边框
- column列容器,分三列,占比 3 : 5 :3
mainbox布局html代码和header同级
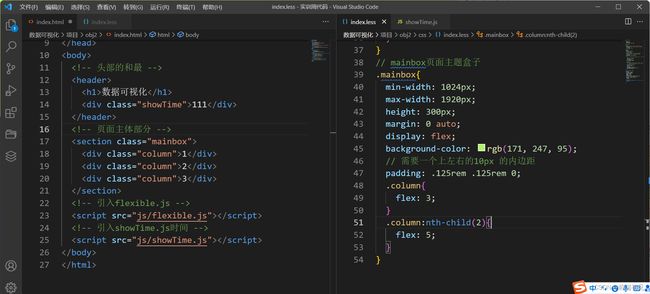
 <section class="mainbox">
    <div class="column">1div>
    <div class="column">2div>
    <div class="column">3div>
  section>
mainbox布局less代码
// mainbox页面主题盒子
.mainbox{
  min-width: 1024px;
  max-width: 1920px;
  height: 300px;
  margin: 0 auto;
  display: flex;
  background-color: rgb(171, 247, 95);
  // 需要一个上左右的10px 的内边距
  padding: .125rem .125rem 0;
  .column{
    flex: 3;
  }
  .column:nth-child(2){
    flex: 5;
  }
}
7.公共面板模块 panel:
- 高度为310px
- 1像素的1px solid rgba(25, 186, 139, 0.17) 边框
- 有line.jpg背景图片
- padding为 上为 0 左右 15px 下为 40px
- 下外边距是15px
- 利用panel 盒子 before 和after 制作上面两个角 大小为 10px 线条为 2px solid #02a6b5
- 新加一个盒子before 和after 制作下侧两个角 宽度高度为 10px
panel公共面板模块布局html代码
  <section class="mainbox">
    <div class="column">

      <div class="panel">
        <div class="panel-footer">div>
      div>
    div>
    <div class="column">2div>
    <div class="column">3div>
  section>
panel公共面板模块布局css代码
.panel{
    position: relative;
    //高度为310px
    height: 3.875rem;
    // 1像素的 1px solid rgba(25, 186, 139, 0.17)  边框
    border:1px solid rgba(25, 186, 139, 0.17);
    //有line.jpg背景图片
    background: url(../images/line.png) rgba(255, 255, 255, 0.04);
    // padding为 上为 0 左右 15px  下为 40px
    padding: 0 .1875rem .5rem;
    //下外边距是 15px
    margin-bottom: .1875rem;
    &::before{
      // 左上角边框
      // 利用panel  盒子 before 和after 制作上面两个角   大小为 10px  线条为  2px solid #02a6b5
      content: '';
      position: absolute;
      top: 0;
      left: 0;
      width: 10px;
      height: 10px;
      border-top:  2px solid #02a6b5 ;
      border-left:  2px solid #02a6b5 ;
    }
    &::after{
      // 右上角边框
      content: '';
      position: absolute;
      top: 0;
      right: 0;
      width: 10px;
      height: 10px;
      border-top:  2px solid #02a6b5 ;
      border-right:  2px solid #02a6b5 ;
    }
    .panel-footer{
      position: absolute;
      bottom: 0;
      left: 0;
      width: 100%;
      &::before{
        // 新加一个盒子before 和after   制作下侧两个角  宽度高度为 10px
        // 左上角边框
        content: '';
        position: absolute;
        bottom: 0;
        left: 0;
        width: 10px;
        height: 10px;
        border-bottom:  2px solid #02a6b5 ;
        border-left:  2px solid #02a6b5 ;
      }
      &::after{
        // 右上角边框
        content: '';
        position: absolute;
        bottom: 0;
        right: 0;
        width: 10px;
        height: 10px;
        border-bottom:  2px solid #02a6b5 ;
        border-right:  2px solid #02a6b5 ;
      }
    }
  }
panel公共面板模块布局完成(效果图)
8.panel盒子完成(图表模块布局):
- 标题模块h2高度为48px 文字颜色为白色 文字大小为20px
- 图标内容模块chart高度为240px
- 以上可以作为panel公共样式部分
图表模块布局html代码
  <section class="mainbox">
    <div class="column">

      <div class="panel bar">

        <h2>柱形图-就业行业h2>
        <div class="chart">图表div>
        <div class="panel-footer">div>
      div>
      <div class="panel bar">

        <h2>折线图-就业行业h2>
        <div class="chart">图表div>
        <div class="panel-footer">div>
      div>
      <div class="panel bar">

        <h2>饼图-就业行业h2>
        <div class="chart">图表div>
        <div class="panel-footer">div>
      div>
    div>
    <div class="column">2div>
    <div class="column">

      <div class="panel bar">

        <h2>柱形图-就业行业h2>
        <div class="chart">图表div>
        <div class="panel-footer">div>
      div>
      <div class="panel bar">

        <h2>折线图-就业行业h2>
        <div class="chart">图表div>
        <div class="panel-footer">div>
      div>
      <div class="panel bar">

        <h2>饼图-就业行业h2>
        <div class="chart">图表div>
        <div class="panel-footer">div>
      div>
    div>
  section>
图表模块布局less代码
// mainbox页面主题盒子
.mainbox{
  min-width: 1024px;
  max-width: 1920px;
  height: 300px;
  margin: 0 auto;
  display: flex;
  // 需要一个上左右的10px 的内边距
  padding: .125rem .125rem 0;
  .column{
    flex: 3;
  }
  .column:nth-child(2){
    flex: 5;
  }
  //panel公共面板
  .panel{
    position: relative;
    //高度为310px
    height: 3.875rem;
    // 1像素的 1px solid rgba(25, 186, 139, 0.17)  边框
    border:1px solid rgba(25, 186, 139, 0.17);
    //有line.jpg背景图片
    background: url(../images/line.png) rgba(255, 255, 255, 0.04);
    // padding为 上为 0 左右 15px  下为 40px
    padding: 0 .1875rem .5rem;
    //下外边距是 15px
    margin-bottom: .1875rem;
    &::before{
      // 左上角边框
      // 利用panel  盒子 before 和after 制作上面两个角   大小为 10px  线条为  2px solid #02a6b5
      content: '';
      position: absolute;
      top: 0;
      left: 0;
      width: 10px;
      height: 10px;
      border-top:  2px solid #02a6b5 ;
      border-left:  2px solid #02a6b5 ;
    }
    &::after{
      // 右上角边框
      content: '';
      position: absolute;
      top: 0;
      right: 0;
      width: 10px;
      height: 10px;
      border-top:  2px solid #02a6b5 ;
      border-right:  2px solid #02a6b5 ;
    }
    .panel-footer{
      position: absolute;
      bottom: 0;
      left: 0;
      width: 100%;
      &::before{
        // 新加一个盒子before 和after   制作下侧两个角  宽度高度为 10px
        // 左上角边框
        content: '';
        position: absolute;
        bottom: 0;
        left: 0;
        width: 10px;
        height: 10px;
        border-bottom:  2px solid #02a6b5 ;
        border-left:  2px solid #02a6b5 ;
      }
      &::after{
        // 右上角边框
        content: '';
        position: absolute;
        bottom: 0;
        right: 0;
        width: 10px;
        height: 10px;
        border-bottom:  2px solid #02a6b5 ;
        border-right:  2px solid #02a6b5 ;
      }
    }
    // 图表模块(布局)
    h2{
      // 标题模块  h2  高度为 48px 文字颜色为白色 文字大小为  20px
      height: .6rem;
      color: white;
      line-height: .6rem;
      text-align: center;
      font-size: .25rem;
      font-weight: 400;
    }
  }
  .chart{
    height: 3rem;
    background-color: pink;
  }
}
图表模块布局完成(效果图)
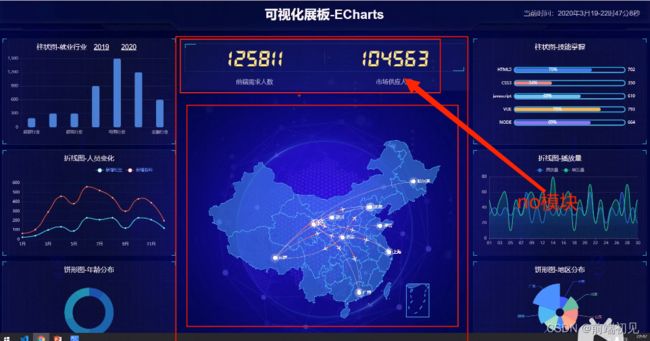
9.数字模块no布局制作:
- 上面是no数字模块
- 下面是map地图模块
- 数字模块 no 有个背景颜色 rgba(101, 132, 226, 0.1); 有个15像素的内边距
- 注意中间列 column 有个 左右 10px 下 15px 的外边距
.数字模块no布局html代码
   <div class="column">

      <div class="no">这是数字模块div>
    div>
.数字模块no布局less代码
// no数字模块
.no{
// 数字模块 no  有个背景颜色 rgba(101, 132, 226, 0.1);
background-color:  rgba(101, 132, 226, 0.1); ;
// 有个15像素的内边距
padding: .1875rem;
}
== 注意中间列 column less代码==
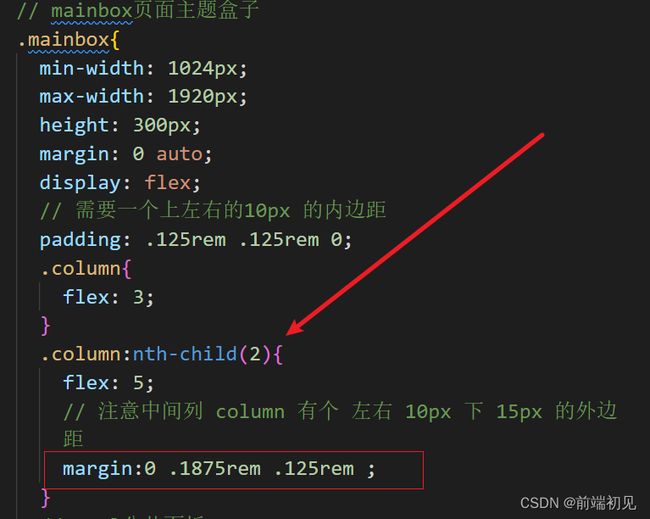
.数字模块no布局完成(效果图)
10.数字模块no-hd布局制作:
uii图
no 模块里面上下划分 上面是数字(no-hd) 下面 是 相关文字说明(no-bd)
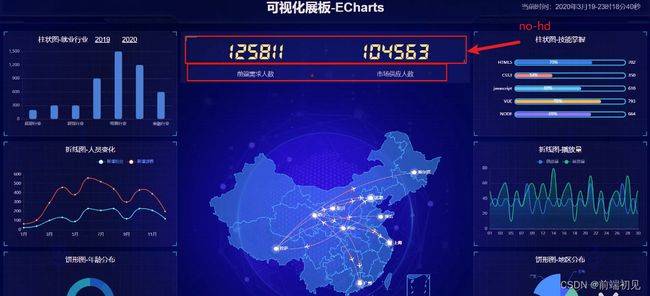
no-hd布局方案
- no-hd 数字模块 有一个边框 1px solid rgba(25, 186, 139, 0.17)
- no-hd 数字模块 里面分为两个小li 每个小li高度为 80px 文字大小为 70px 颜色为 #ffeb7b 字体是图标字体 electronicFont
- no-hd 利用 after 和 before制作2个小角, 边框 2px solid #02a6b5 宽度为 30px 高度为 10px
- 小竖线 给 第一个小li after 就可以 1px宽 背景颜色为 rgba(255, 255, 255, 0.2); 高度 50% top 25% 即可
.no-hd布局html代码
    <div class="column">

      <div class="no">
        <div class="no-hd">
          <ul>
            <li>23856li>
            <li>67239li>
          ul>
        div>
        <div class="no-bd">文字div>
      div>
    div>
.no-hd布局less代码
// no数字模块
.no {
  // 数字模块 no  有个背景颜色  rgba(101, 132, 226, 0.1);
  background-color: rgba(101, 132, 226, 0.1);
  ;
  // 有个15像素的内边距
  padding: .1875rem;

  .no-hd {
    // no-hd 数字模块  有一个边框 1px solid rgba(25, 186, 139, 0.17)
    border: 1px solid rgba(25, 186, 139, 0.17);
    position: relative;

    // 左上角
    &::before {
      // no-hd 利用 after 和 before制作2个小角
      content: '';
      position: absolute;
      top: 0;
      left: 0;
      // 宽度为 30px
      width: 30px;
      // 高度为 10px
      height: 10px;
      // 边框 2px solid #02a6b5
      border-top: 2px solid #02a6b5;
      border-left: 2px solid #02a6b5;
    }

    // 右下角
    &::after {
      // no-hd 利用 after 和 before制作2个小角
      content: '';
      position: absolute;
      bottom: 0;
      right: 0;
      // 宽度为 30px
      width: 30px;
      // 高度为 10px
      height: 10px;
      // 边框 2px solid #02a6b5
      border-bottom: 2px solid #02a6b5;
      border-right: 2px solid #02a6b5;
    }

    ul {
      display: flex;
    }

    li {
      flex: 1;
      // no-hd 数字模块 里面分为两个小li 每个小li高度为80px 文字大小为70px 颜色为 #ffeb7b 字体是图标字体  electronicFont
      text-align: center;
      line-height: 1rem;
      font-size: .875rem;
      color: #ffeb7b;
      font-family: "electronicFont";
      position: relative;
      &::after {
        // 小竖线 给 第一个小li after 就可以
        content: '';
        position: absolute;
        //  1px宽
        width: 1px;
        // top 25%
        top: 25%;
        right: 0;
        // 高度 50%
        height: 50%;
        //背景颜色为 rgba(255, 255, 255, 0.2);
        background-color: rgba(255, 255, 255, 0.2);
      }
    }
  }
}
.no-hd布局数字声明less代码
/* 声明字体*/
@font-face {
  font-family: electronicFont;
  src: url(../font/DS-DIGIT.TTF);
}
.数字模块no-hd布局完成(效果图)
11.数字模块no-bd布局制作:
no-bd布局方案
- no-bd 里面也有两个小li 高度为 40px 文字颜色为 rgba(255, 255, 255, 0.7) 文字大小为 18px 上内边距为 10px
.no-bd布局html代码
    <div class="column">

      <div class="no">
        <div class="no-hd">
          <ul>
            <li>23856li>
            <li>67239li>
          ul>
        div>
        <div class="no-bd">
          <ul>
            <li>前端需求人数li>
            <li>市场供应人数li>
          ul>
        div>
      div>
    div>
.no-bd布局less代码
// no数字模块
.no {
  // 数字模块 no  有个背景颜色  rgba(101, 132, 226, 0.1);
  background-color: rgba(101, 132, 226, 0.1);
  ;
  // 有个15像素的内边距
  padding: .1875rem;

  .no-hd {
    // no-hd 数字模块  有一个边框 1px solid rgba(25, 186, 139, 0.17)
    border: 1px solid rgba(25, 186, 139, 0.17);
    position: relative;

    // 左上角
    &::before {
      // no-hd 利用 after 和 before制作2个小角
      content: '';
      position: absolute;
      top: 0;
      left: 0;
      // 宽度为 30px
      width: 30px;
      // 高度为 10px
      height: 10px;
      // 边框 2px solid #02a6b5
      border-top: 2px solid #02a6b5;
      border-left: 2px solid #02a6b5;
    }

    // 右下角
    &::after {
      // no-hd 利用 after 和 before制作2个小角
      content: '';
      position: absolute;
      bottom: 0;
      right: 0;
      // 宽度为 30px
      width: 30px;
      // 高度为 10px
      height: 10px;
      // 边框 2px solid #02a6b5
      border-bottom: 2px solid #02a6b5;
      border-right: 2px solid #02a6b5;
    }

    ul {
      display: flex;
    }

    li {
      flex: 1;
      // no-hd 数字模块 里面分为两个小li 每个小li高度为80px 文字大小为70px 颜色为 #ffeb7b 字体是图标字体  electronicFont
      text-align: center;
      line-height: 1rem;
      font-size: .875rem;
      color: #ffeb7b;
      font-family: "electronicFont";
      position: relative;
      &::after {
        // 小竖线 给 第一个小li after 就可以
        content: '';
        position: absolute;
        //  1px宽
        width: 1px;
        // top 25%
        top: 25%;
        right: 0;
        // 高度 50%
        height: 50%;
        //背景颜色为 rgba(255, 255, 255, 0.2);
        background-color: rgba(255, 255, 255, 0.2);
      }
    }
  }
  .no-bd{
    // no-bd 里面也有两个小li
    ul{
      display: flex;
      li{
        flex: 1;
        // 高度为 40px
        height: .5rem;
        line-height: .5rem;
        // 文字大小为 18px
        font-size: .225rem;
        text-align: center;
        // 上内边距为  10px上内边距为 10px
        padding-top: .125rem;
        //文字颜色为 rgba(255, 255, 255, 0.7)
        color:rgba(255, 255, 255, 0.7);
      }
    }
  }
}
.数字模块no-bd布局完成(效果图)
12.地图模块(map)布局制作:
地图模块布局方案
- 地图模块(map)高度为 810px 里面包含4个盒子 chart 放图表模块 球体盒子(map1) 旋转盒子1(map2) 旋转盒子2(map3)
map1球体模块制作
map+map1布局html代码
      <div class="map">

        <div class="map1">div>
      div>
    div>
map+map1布局less代码
// map地图模块
.map{
  position: relative;
  // 地图模块高度为 810px
  height: 10.125rem;
  // map1球体盒子模块
  .map1{
    // 大小为 518px
    width: 6.475rem;
    height: 6.475rem;
    // 要加背景图片
    background: url(../images/map.png);
    background-size: 100%;
    // 透明度 0.3
    opacity: 0.3;
    // 定位到最中央
    position: absolute;
    top:50%;
    left: 50%;
    transform: translate(-50%,-50%);
  }
}
旋转盒子1(map2)*
map2旋转盒子1模块布局方案
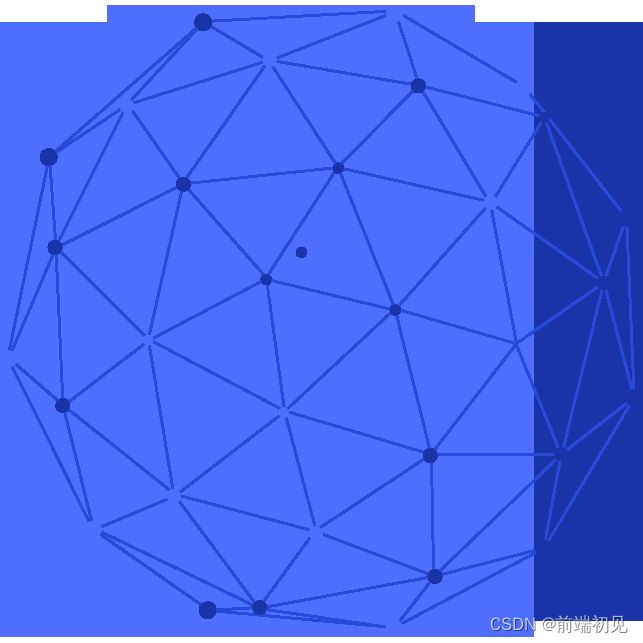
- 旋转1 map 2 大小为 643px 要加背景图片 因为要缩放100% 定位到中央 透明度 .6 做旋转动画 利用z-index压住球体
map2布局html代码
   <div class="map">

        <div class="map1">div>

        <div class="map2">div>
      div>
map2布局less代码
  // map2旋转盒子1模块
  .map2{
    //大小为 643px
    width: 8.0375rem;
    height: 8.0375rem;
    background: url(../images/lbx.png);
    background-size: 100%;
    // 定位到中央
    position:absolute ;
    top:50%;
    left: 50%;
    transform: translate(-50%,-50%);
    // 透明度  .6
    opacity: .6;
    // 使用旋转动画rotate1
    animation: rotate1 15s linear infinite;
    // linear匀速 无限循环
  }
  // map2旋转盒子1做旋转动画
  @keyframes rotate1 {
    from{
      transform:    translate(-50%,-50%)
      rotate(0deg);
    }
    to{
      transform:    translate(-50%,-50%)
      rotate(360deg);
    }
  }
map2模块布局完成(效果图)
旋转箭头盒子2(map3)
map3旋转箭头盒子2(模块布局方案
- 旋转2 map3 大小为 566px 要加背景图片 因为要缩放100% 定位到中央 旋转动画 注意是逆时针
      <div class="map">

        <div class="map1">div>

        <div class="map2">div>

        <div class="map3">div>
      div>
map3布局less代码
  // map3旋转箭头盒子2模块
  .map3 {
    //大小为 643px
    width: 7.075rem;
    height: 7.075rem;
    background: url(../images/jt.png);
    background-size: 100%;
    // 定位到中央
    position: absolute;
    top: 50%;
    left: 50%;
    transform: translate(-50%, -50%);
    // 透明度  .6
    opacity: .6;
    // 使用旋转动画rotate1
    animation: rotate2 15s linear infinite;
    // linear匀速 无限循环
  }
    // map3旋转箭头盒子2做旋转动画
  @keyframes rotate2 {
    from {
      transform: translate(-50%, -50%) rotate(0deg);
    }

    to {
      transform: translate(-50%, -50%) rotate(-360deg);
    }
  }
map2模块布局完成(效果图)
地图模块(chart)
chart地图模块html代码
      <div class="map">

        <div class="map1">div>

        <div class="map2">div>

        <div class="map3">div>

        <div class="chart">div>
      div>
chart地图模块less代码
  .chart{
    position: absolute;
    top: 0;
    left: 0;
    width: 100%;
    height: 10.125rem;
    background-color: #ffeb7b;
  }
chart模块布局完成(效果图)
这里只做了布局,后期会导入地图

页面布局完成
五、Echarts开源可视化图表库
1.常见的数据可视化库:
- D3.js 目前 Web 端评价最高的 Javascript 可视化工具库(入手难)
- ECharts.js 百度出品的一个开源 Javascript 数据可视化库,目前已经被Apache托管
- Highcharts.js 国外的前端数据可视化库,非商用免费,被许多国外大公司所使用
- AntV 蚂蚁金服全新一代数据可视化解决方案 等等
- Highcharts 和 Echarts 就像是 Office 和 WPS 的关系
2.Echarts 简介
☞官网地址
ECharts,一个使用 JavaScript 实现的开源可视化库,可以流畅的运行在 PC 和移动设备上,兼容当前绝大部分浏览器(IE8/9/10/11,Chrome,Firefox,Safari等),底层依赖矢量图形库 ZRender,提供直观,交互丰富,可高度个性化定制的数据可视化图表。
特点:
- 是一个JS插件
- 性能好可流畅运行PC与移动设备
- 兼容主流浏览器
- 提供很多常用图表,且可定制。
- 折线图、柱状图、散点图、饼图、K线图
2.Echarts体验使用:
使用步骤:
- 步骤1:下载并引入echarts.js文件
图表依赖这个js库 - 步骤2:准备一个具备大小的DOM容器
生成的图表会放入这个容器内 - 步骤3:初始化echarts实例对象
实例化echarts对象 - 步骤4:指定配置项和数据option
根据具体的需要修改配置选项 - 步骤5:将配置项设置给echarts实例对象
让echarts对象根据修改好的配置生效
步骤1:下载并引入echarts.js文件
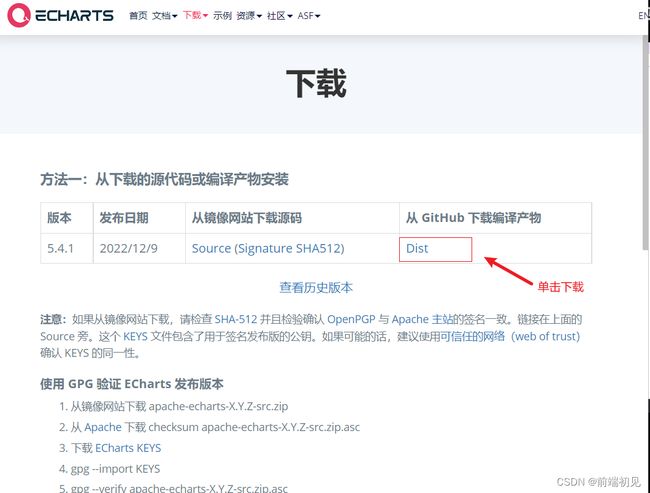
获取和引入Echarts:
☞echarts获取网址教程
Apache ECharts 提供了多种安装方式,你可以根据项目的实际情况选择以下任意一种方式安装。Apache ECharts 提供了多种安装方式,你可以根据项目的实际情况选择以下任意一种方式安装。
 <!-- 步骤1:引入echarts -->
  <script src="../obj2/js/echarts.min.js"></script>
步骤2:准备一个具备大小的DOM容器
DOM容器html代码
<div class="box">div>
DOM容器css代码
    .box{
      width: 800px;
      height: 400px;
      background-color: bisque;
    }
步骤3:初始化echarts实例对象
echarts.init(dom容器) 初始化实例对象
初始化echarts实例对象js代码
  <script>
    // 步骤3:初始化echarts实例对象
    var mychart=echarts.init(document.querySelector('.box'))
    // echarts.init(dom容器) 初始化实例对象
  </script>
步骤4:指定配置项和数据option
配置项和数据的配置可以参考echarts官方文档配置项手册
☞配置项手册
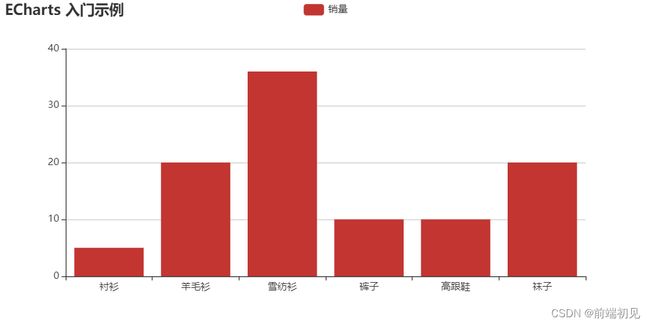
指定配置项和数据js代码
    // 指定图表的配置项和数据
    var option = {
      title: {
        text: 'ECharts 入门示例'
      },
      tooltip: {},
      legend: {
        data: ['销量']
      },
      xAxis: {
        data: ['衬衫', '羊毛衫', '雪纺衫', '裤子', '高跟鞋', '袜子']
      },
      yAxis: {},
      series: [
        {
          name: '销量',
          type: 'bar',
          data: [5, 20, 36, 10, 10, 20]
        }
      ]
    };
步骤5:将配置项设置给echarts实例对象
     // 使用刚指定的配置项和数据显示图表。把配置想给实例对象
     mychart.setOption(option);
2.Echarts基础配置:
配置根据自己的需求设置,更多的可以参考下方网址链接,进入Echarts配置项手册进行阅读了解~
☞配置项手册
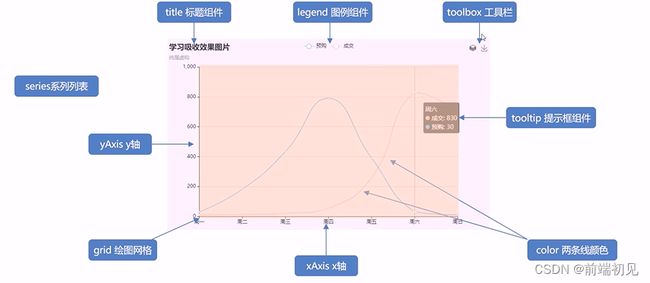
主要配置:series xAxis yAxis grid tooltip title legend color
- title(标题组件,用于设置图表标题)
- toolbox(工具箱盒子组件)
- tooltip(提示框组件)
- trigger (触发方式)
- legend (图例组件)
- grid(网格配置可以控制线形图 柱状图 图表大小)
- left(图表距离dom盒子左侧的距离)
- right(图表距离右侧盒子左侧的距离)
- bottom
- containLabel(是否显示刻度标签 如果是true 就显示)
- xAxis( 设置x轴的相关配置)
- type: ‘category’(图表轴的类型)
- category(类目轴)
- value( 数值轴)
- boundaryGap(是否让我们的线条和坐标轴有缝隙 true有,false没有)
- yAxis( 设置y轴的相关配置)
- series(系列图表配置 它决定着显示那种类型的图表)
- name(这条数据的名字)
- type(图表类型)
- stack(数据堆叠,同个类目轴上系列配置相同的
stack值后 后一个系列的值会在前一个系列的值上相加。) - data 轴的数据
- series里面有了 name值则 legend里面的data可以删掉
- color(调色盘颜色列表)
总结
素材源码联系我免费获取,后续会放到git仓库里
持续更新中
如果这篇【文章】有帮助到你,希望可以给我点个赞,创作不易,如果有对前端端或者对python感兴趣的朋友,请多多关注,咱们一起探讨和努力!!!
个人主页 : 前端初见


