import HighCharts from 'highcharts'; // highCharts图表

import highstock from 'highcharts/modules/stock';

highstock(HighCharts);

HighCharts.setOptions({
  lang: {
    thousandsSep: '', // 这里也可以写',',页面会显示为1,433
  },
});
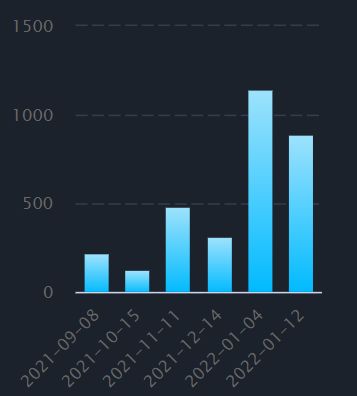
画柱状图
summaryHighColumnEcharts() {
const that = this;
let maxNum = 7;
if (that.summaryRightColumnArr && that.summaryRightColumnArr.length < maxNum) {
maxNum = that.summaryRightColumnArr.length - 1;
}
let flag = false;
if (maxNum >= 7) {
flag = true;
}
HighCharts.chart('dateStatistics', {
title: {
text: '',
},
credits: {
enabled: false,
},
xAxis: {
categories: that.summaryRightColumnDayArr,
crosshair: true,
min: 0,
max: maxNum,
},
scrollbar: {
enabled: flag,
height: 5,
barBackgroundColor: '#39414d',
barBorderColor: '#39414d',
rifleColor: '#39414d',
barBorderRadius: 5,
buttonBorderWidth: 0,
buttonArrowColor: '#12181F',
buttonBackgroundColor: '#12181F',
buttonBorderRadius: 7,
trackBackgroundColor: '#12181F',
trackBorderWidth: 1,
trackBorderRadius: 8,
trackBorderColor: '#12181F',
},
yAxis: {
max: Math.max(...that.summaryRightColumnArr),
gridLineDashStyle: 'longdash',
gridLineColor: '#333D4D',
title: {
text: null,
},
},
legend: {
enabled: false,
},
chart: {
renderTo: 'dateStatistics',
type: 'column',
backgroundColor: 'transparent',
panning: true,
marginBottom: 70,
minPointLength: 2,
},
plotOptions: {
column: {
borderWidth: 0,
pointWidth: 16,
},
series: {
minPointLength: 3,
color: {
linearGradient: {
x1: 0, x2: 0, y1: 1, y2: 0,
},
stops: [
[0, '#00BAFF'],
[1, '#9DE2FC'],
],
},
},
},
series: [
{
name: '数量',
data: this.data,
},
],
});
},

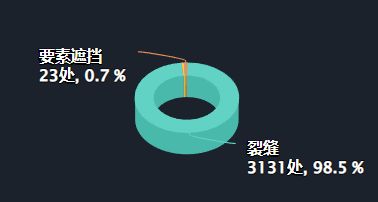
3d饼状图
    // 3d饼状图
    summaryHighPieEcharts() {
      HighCharts.chart('diseaseStatistics', {
        title: {
          text: '',
        },
        // 禁用右下角版权信息
        credits: {
          enabled: false,
        },
        chart: {
          // 放置图表的div的id
          renderTo: 'diseaseStatistics',
          type: 'pie',
          backgroundColor: 'transparent',
          options3d: {
            enabled: true,
            alpha: 48, // 内旋转角度
            // beta: 0, // 外旋转角度
          },
        //   height: 190, // 设置高度
        },
        plotOptions: {
          pie: {
            // 是否允许被点击,为true时点击饼图的一块
            // allowPointSelect: true,
            // 鼠标样式为小手
            cursor: 'pointer',
            // 环的大小
            innerSize: that.innerSize,
            // 饼图的厚度
            depth: 35,
            dataLabels: {
              enabled: true,
              color: '#fff',
              // userHtml: true, // 是否使用formatter内的标签样式
              // formatter: function() {
              //   // console.log('===', this);
              //   return `<div>${this.point.name}</div><br/><div>${this.y}, ${this.percentage.toFixed(1)}%</div>`
              // },
              format: '{point.name}
 {point.y}处, {point.percentage:.1f} %',
              style: {
                fontSize: '14px',
              },
              distance: 10,
            },
          },
        },
        colors: ['#61D2C3', '#F2657D', '#8B83EB', '#f8d135',
          '#51BAFC', '#ED8F5B', '#4782E6', '#ff3c2a',
          '#5adb62', '#9504fc', '#f29df5', '#faf8f8',
        ],
        series: [
          {
            name: '',
            type: 'pie',
            data: this.data2,
          },
        ],
      });
    },


