Leaflet.Graticule源码分析以及经纬度汉化展示
目录
前言
一、源码分析
1、类图设计
2、时序调用
3、调用说明
二、经纬度汉化
1、改造前
2、汉化
3、改造效果
总结
前言
在之前的博客基于Leaflet的Webgis经纬网格生成实践中,已经深入介绍了Leaflet.Graticule的实际使用方法和进行了简单的源码分析。认真看过实例效果的朋友一定会发现,在页面上生成的网格中,其边线的经度和维度都是英文的,如下图所示:
那如何进行汉化改造支持呢,这里需要进行显示支持。本文将重点详细分析这款经纬网生成的源码,以及其内在的调用逻辑,通过本文,可以让您知道经纬网的构造原理,做到知其然知其所以然。
一、源码分析
1、类图设计
相对来说,这种前端的工具型框架设计得还是比较简单的,没有过多的依赖。相当于后端的一个类,这里采用OOP的方式进行源码分析。众所周知,通常一个类,包含属性和方法。Leaflet.Graticule也无外乎如此,其属性定义如下图所示。
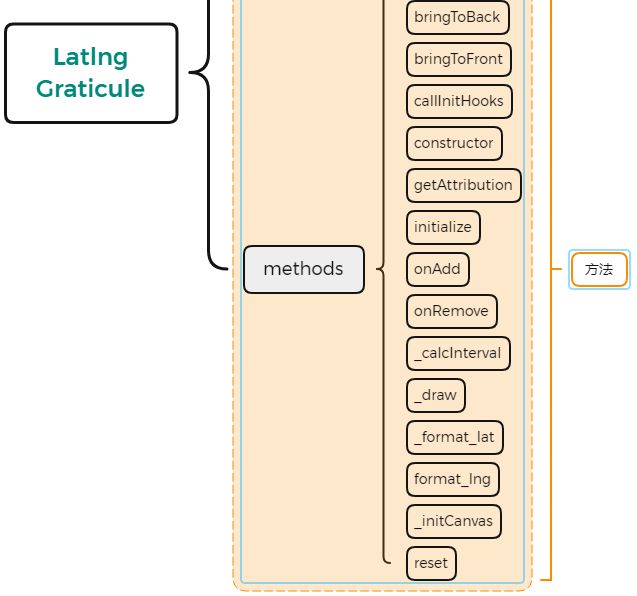
由于一张图的篇幅有限,我们暂且把方法给隐藏起来了。其具体的方法架构如下图:
2、时序调用
时序图可以用来很好的描述方法内部的流转和调用逻辑,方便对某一个方法的全生命进行跟踪和展示。这里也同样采用这种方法来进行调用流程的阐述。
3、调用说明
第一步:初始化配置参数,在这里会调用构造方法进行对象创建。其定义参考如下:
var obj = L.latlngGraticule({
	showLabel: true,
	color: 'red',
	zoomInterval: {
		latitude: [
			{start: 2, end: 4, interval: 30},
			{start: 5, end: 20, interval: 5}
			],
			longitude: [
				{start: 2, end: 4, interval: 30},
				{start: 5, end: 20, interval: 5}
			]
		}
	});
第二步、调用Layer.js的addTo方法进行地图添加。
addTo: function (map) {
        map.addLayer(this);
        return this;
    }
第三步、通过addLayer将地图添加到定义的leaflet地图中,代码如下:
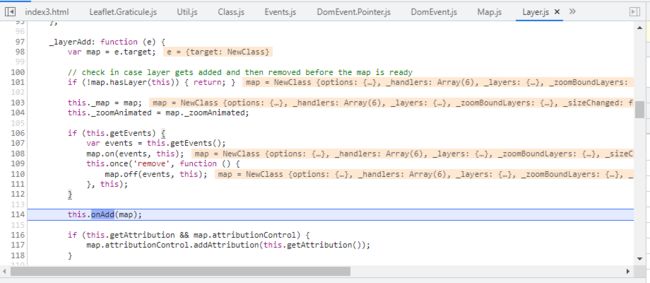
_layerAdd: function (e) {
		var map = e.target;

		// check in case layer gets added and then removed before the map is ready
		if (!map.hasLayer(this)) { return; }

		this._map = map;
		this._zoomAnimated = map._zoomAnimated;

		if (this.getEvents) {
			var events = this.getEvents();
			map.on(events, this);
			this.once('remove', function () {
				map.off(events, this);
			}, this);
		}

		this.onAdd(map);

		if (this.getAttribution && map.attributionControl) {
			map.attributionControl.addAttribution(this.getAttribution());
		}

		this.fire('add');
		map.fire('layeradd', {layer: this});
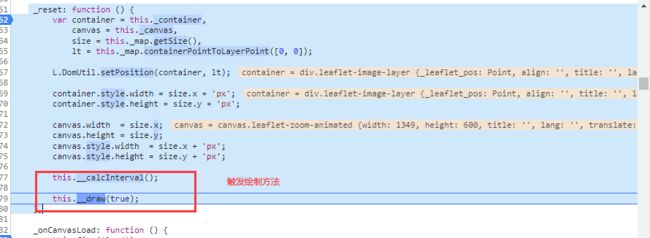
第四步、通过reset触发绘制方法,进行基于Canvas的经纬度线的绘制。
 _reset: function () {
        var container = this._container,
            canvas = this._canvas,
            size = this._map.getSize(),
            lt = this._map.containerPointToLayerPoint([0, 0]);

        L.DomUtil.setPosition(container, lt);

        container.style.width = size.x + 'px';
        container.style.height = size.y + 'px';

        canvas.width  = size.x;
        canvas.height = size.y;
        canvas.style.width  = size.x + 'px';
        canvas.style.height = size.y + 'px';

        this.__calcInterval();

        this.__draw(true);
    },
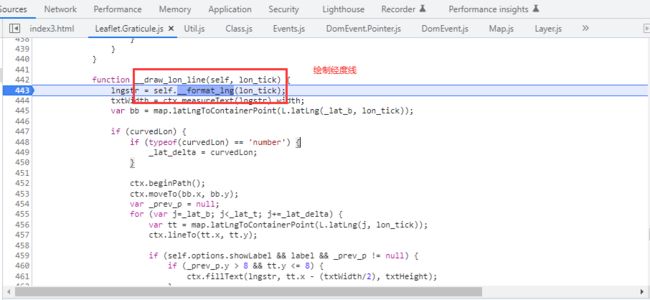
第五步、绘制经纬线
function __draw_lon_line(self, lon_tick) {
                lngstr = self.__format_lng(lon_tick);
                txtWidth = ctx.measureText(lngstr).width;
                var bb = map.latLngToContainerPoint(L.latLng(_lat_b, lon_tick));

                if (curvedLon) {
                    if (typeof(curvedLon) == 'number') {
                        _lat_delta = curvedLon;
                    }

                    ctx.beginPath();
                    ctx.moveTo(bb.x, bb.y);
                    var _prev_p = null;
                    for (var j=_lat_b; j<_lat_t; j+=_lat_delta) {
                        var tt = map.latLngToContainerPoint(L.latLng(j, lon_tick));
                        ctx.lineTo(tt.x, tt.y);

                        if (self.options.showLabel && label && _prev_p != null) {
                            if (_prev_p.y > 8 && tt.y <= 8) {
                                ctx.fillText(lngstr, tt.x - (txtWidth/2), txtHeight);
                            }
                            else if (_prev_p.y >= hh && tt.y < hh) {
                                ctx.fillText(lngstr, tt.x - (txtWidth/2), hh-2);
                            }
                        }

                        _prev_p = {x:tt.x, y:tt.y, lon:lon_tick, lat:j};
                    }
                    ctx.stroke();
                }
                else {
                    var __lat_top = _lat_t;
                    var tt = map.latLngToContainerPoint(L.latLng(__lat_top, lon_tick));
                    if (curvedLat) {
                        __lat_top = map.containerPointToLatLng(L.point(tt.x, 0));
                        __lat_top = __lat_top.lat;
                        if (__lat_top > 90) { __lat_top = 90; }
                        tt = map.latLngToContainerPoint(L.latLng(__lat_top, lon_tick));

                        var __lat_bottom = map.containerPointToLatLng(L.point(bb.x, hh));
                        __lat_bottom = __lat_bottom.lat;
                        if (__lat_bottom < -90) { __lat_bottom = -90; }
                        bb = map.latLngToContainerPoint(L.latLng(__lat_bottom, lon_tick));
                    }

                    ctx.beginPath();
                    ctx.moveTo(tt.x, tt.y+1);
                    ctx.lineTo(bb.x, bb.y-1);
                    ctx.stroke();

                    if (self.options.showLabel && label) {
                        ctx.fillText(lngstr, tt.x - (txtWidth/2), txtHeight+1);
                        ctx.fillText(lngstr, bb.x - (txtWidth/2), hh-3);
                    }
                }
            };
第七步、将经过绘制的经纬网通过canvas渲染到html页面进行展示
经过以上的步骤,就完成了经纬网的生成。以上代码只是对源代码进行深入讲解,实际使用的过程中,不是为了调整相关参数或者调整运行逻辑,可以不必要进行代码改造,直接使用即可。
二、经纬度汉化
1、改造前
在上面的源码分析中,我们会进行经纬度的格式化,详细代码在__format_lat和__format_lng这两个方法中,这里我们以__format_lng为例:
__format_lng: function(lng) {
        if (this.options.lngFormatTickLabel) {
            return this.options.lngFormatTickLabel(lng);
        }

        // todo: format type of float
        if (lng > 180) {
            return '' + (360 - lng) + 'W';
        }
        else if (lng > 0 && lng < 180) {
            return '' + lng + 'E';
        }
        else if (lng < 0 && lng > -180) {
            return '' + (lng*-1) + 'W';
        }
        else if (lng == -180) {
            return '' + (lng*-1);
        }
        else if (lng < -180) {
            return '' + (360 + lng) + 'W';
        }
        return '' + lng;
    }
可以看到,代码中仔细规定了经度的展示单位,W为西经,E表示东经。了解了以上知识就可以进行汉化改造,直接修改相应参数即可。
2、汉化
__format_lng: function(lng) {
        if (this.options.lngFormatTickLabel) {
            return this.options.lngFormatTickLabel(lng);
        }
        if (lng > 180) {
			return '' + (360 - lng) + '西经';
        }
        else if (lng > 0 && lng < 180) {
			return '' + lng + '东经';
        }
        else if (lng < 0 && lng > -180) {
			return '' + (lng*-1) + '西经';
        }
        else if (lng == -180) {
            return '' + (lng*-1);
        }
        else if (lng < -180) {
			return '' + (360 + lng) + '西经';
        }
        return '' + lng;
    }
3、改造效果
注意:这里只改造了经度,维度信息还没有修改,您可以尝试动手将维度值也进行合理的汉化。
总结
以上就是本文的主要内容,本文将重点详细分析这款经纬网生成的源码,以及其内在的调用逻辑,通过本文,可以让您知道经纬网的构造原理,做到知其然知其所以然。


