生物信息学R分析工具包ggkegg的详细使用方法
ggkegg介绍
ggkegg 是一个用于生物信息学研究的工具,可以用于分析和解释基因组学数据,并将其与已知的KEGG数据库进行比较。ggkegg 是从 KEGG 获取信息并使用 ggplot2 和 ggraph 进行解析、分析和可视化的工具包,结合其他使用 KEGG 进行生物功能研究的软件包。该工具旨在利用图形语法来可视化 KEGG 的复杂组件。对于 Python,请使用 pykegg,结合 plotnine,它提供了几乎与 ggkegg 相同的功能,可以与诸如 gseapy、PyDESeq2 以及单细胞转录组分析库 scanpy 等软件包一起使用,进行类似的功能。
ggkegg 的基本使用方法:
-
安装和加载 ggkegg 包:首先,您需要确保已在 R 环境中安装了 ggkegg 包。可以使用
install.packages("ggkegg")命令安装该包。然后,使用library(ggkegg)命令加载该包。# devtools::install_github("noriakis/ggkegg") library(ggkegg) -
导入数据:将您的基因组学数据导入 R 环境。ggkegg 支持各种不同的基因组学数据格式,例如基因表达数据、基因注释文件等。
-
使用 ggkegg 函数: 使用
ggkegg()函数来创建 ggplot2 图表,该函数需要传入两个参数:data: 导入的数据集,例如基因表达矩阵或注释文件。Sample1 Sample2 Sample3 Gene1 10 8 12 Gene2 5 7 9 Gene3 3 2 4id: KEGG ID,用于指定您要分析的特定通路或代谢网络。
-
可视化结果:使用
ggplot2函数对结果进行可视化。 ggkegg 返回一个具有不同图层的 ggplot2 图表,可以使用 ggplot2 提供的其他函数对其进行定制和修改。例如,您可以添加标题、修改颜色、添加标签等。
下面是一个简单示例,展示如何使用 ggkegg 创建一个基因表达通路图:
library(ggkegg)
library(ggplot2)

# 导入基因表达数据
data <- read.table("gene_expression.txt", header = TRUE)

# 使用 ggkegg 函数
kegg_plot <- ggkegg(data, id = "path:hsa05202")

# 可视化结果
kegg_plot +
  labs(title = "Pathway Analysis", x = "Genes", y = "Expression") +
  scale_fill_manual(values = c("blue", "green", "red")) +
  theme_bw()
在这个示例中,我们首先加载 ggkegg 和 ggplot2 包。然后,我们导入一个基因表达矩阵,并使用 ggkegg() 函数创建一个基因表达通路图。最后,我们使用 ggplot2 函数进行进一步的定制和修改,例如添加标题、修改颜色和背景等。
原网站介绍和使用:
Chapter 1 About | ggkegg (noriakis.github.io)
Pathway分析
提供 ggkegg 一个通路ID,它将获取信息,解析数据并生成 ggraph 对象。在其中,使用 parse_kgml 或 pathway 函数来返回 igraph 或 tbl_graph 对象。它可以用于 KEGG PATHWAY 数据库中列出的所有生物体中的通路。pathway 函数是一个核心函数,它下载并解析 KGML 文件。如果文件已经存在于当前工作目录中,则不会重新下载。该函数还提取包含在通路中的反应作为边。如果存在由 type=line 表示的节点,该函数将根据其坐标将这些节点转换为边。此转换是通过 process_line 函数执行的。
需要使用到的R软件包
library(ggkegg)
library(ggfx)
library(ggraph)
library(igraph)
library(clusterProfiler)
library(dplyr)
library(tidygraph)
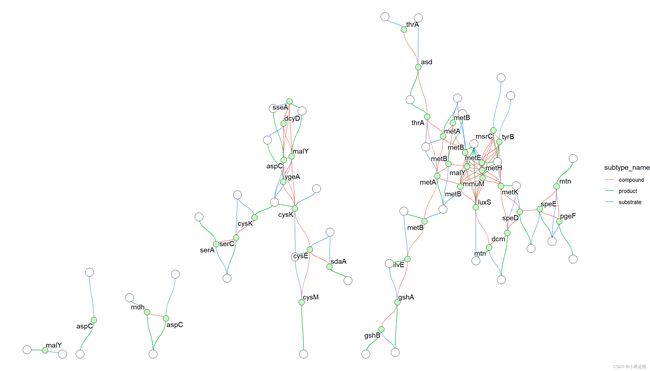
igraph可视化样例1:
g <- ggkegg(pid="eco00270",
            convert_org = c("pathway","eco"),
            delete_zero_degree = TRUE,
            return_igraph = TRUE)
gg <- ggraph(g, layout="stress")
gg$data$type |> unique()
#> [1] "map"      "compound" "gene"
gg + geom_edge_diagonal(
  aes(color=subtype_name,
      filter=type!="maplink"))+
  geom_node_point(
  aes(filter= !type%in%c("map","compound")),
    fill=gg$data[!gg$data$type%in%c("map","compound"),]$bgcolor,
    color="black",
    shape=21, size=4
  )+
  geom_node_point(
    aes(filter= !type%in%c("map","gene")),
    fill=gg$data[!gg$data$type%in%c("map","gene"),]$bgcolor,
    color="black",
    shape=21, size=6
  )+
  geom_node_text(
    aes(label=converted_name,
        filter=type=="gene"),
    repel=TRUE,
    bg.colour="white")+
  theme_void()
这个例子首先获取 eco00270 的信息并解析它,将通路和 eco 标识符转换,删除零度节点,并返回 igraph 对象。
KGML 中描述的 x 坐标、y 坐标、宽度和高度分别列为 x、y、width 和 height。基于这些信息,计算并将 xmin、xmax、ymin 和 ymax 存储在节点表中。
突出显示样例1
以突出显示代谢通路(ko01100)的示例,使用 M00021 的定义。highlight_module 函数接受 kegg_module 类对象,并返回哪些边涉及模块内的反应,以及哪些节点是参与反应的化合物的布尔值。请注意,这不会产生与 KEGG mapper 完全相同的输出。这会向 tbl_graph 添加新列,对于满足相应条件的节点和边,将其标记为 TRUE。
g <- pathway("ko01100") |>
  process_line() |>
  highlight_module(module("M00021")) |>
  mutate(compound=convert_id("compound"))

g |> ggraph(x=x, y=y) +
  geom_node_point(size=1, aes(color=I(fgcolor),
    filter=fgcolor!="none" & type!="line"))+
  geom_edge_link(width=0.1, aes(color=I(fgcolor),
                                filter=type=="line"& fgcolor!="none"))+
  with_outer_glow(
    geom_edge_link(width=1,
                   aes(color=I(fgcolor),
                       filter=fgcolor!="none" & M00021)),
    colour="red", expand=3
  )+
  with_outer_glow(
    geom_node_point(size=2,
                   aes(color=I(fgcolor),
                       filter=fgcolor!="none" & M00021)),
    colour="red", expand=3
  )+
  theme_void()
可视化突出显示样例2
代码:
library(ggkegg)
library(ggfx)
library(igraph)
library(tidygraph)
library(dplyr)

pathway("ko01100") |>
    process_line() |>
    highlight_module(module("M00021")) |>
    highlight_module(module("M00338")) |>
    ggraph(x=x, y=y) +
        geom_node_point(size=1, aes(color=I(fgcolor),
            filter=fgcolor!="none" & type!="line")) +
        geom_edge_link0(width=0.1, aes(color=I(fgcolor),
            filter=type=="line"& fgcolor!="none")) +
        with_outer_glow(
            geom_edge_link0(width=1,
                aes(color=I(fgcolor),
                    filter=(M00021 | M00338))),
            colour="red", expand=5
        ) +
        with_outer_glow(
            geom_node_point(size=1.5,
                aes(color=I(fgcolor),
                    filter=(M00021 | M00338))),
            colour="red", expand=5
        ) +
        geom_node_text(size=2,
            aes(x=x, y=y,
                label=graphics_name,
                filter=name=="path:ko00270"),
            repel=TRUE, family="sans", bg.colour="white") +
        theme_void()
基于ggraph样例:
代码:
g <- pathway("hsa04110")
pseudo_lfc <- sample(seq(0,3,0.1), length(V(g)), replace=TRUE)
names(pseudo_lfc) <- V(g)$name

ggkegg("hsa04110",
    convert_org = c("pathway","hsa","ko"),
    numeric_attribute = pseudo_lfc)+
    geom_edge_parallel2(
        aes(color=subtype_name),
        arrow = arrow(length = unit(1, 'mm')),
        start_cap = square(1, 'cm'),
        end_cap = square(1.5, 'cm')) +
    geom_node_rect(aes(filter=.data$type == "group"),
        fill="transparent", color="red") +
    geom_node_rect(aes(fill=numeric_attribute,
        filter=.data$type == "gene")) +
    geom_node_text(aes(label=converted_name,
        filter=.data$type == "gene"),
        size=2.5,
        color="black") +
    with_outer_glow(
        geom_node_text(aes(label=converted_name,
            filter=converted_name=="PCNA"),
            size=2.5, color="red"),
        colour="white", expand=4
    ) +
    scale_edge_color_manual(values=viridis::plasma(11)) +
    scale_fill_viridis(name="LFC") +
    theme_void()
在突出显示通路中多个数值时使用多个尺度样例:
使用 ggh4x,你可以使用 scale_fill_multi() 将多个值绘制在各自的比例尺上。在 stana 包的 plotKEGGPathway 中使用此功能进行物种内多样性分析。有关函数用法,请参考 ggh4x 网站和相关代码。
library(ggh4x)
test <- geneList[1:100]
names(test) <- paste0("hsa:",names(test))
g <- pathway("hsa04110") |>
  mutate(value1=node_numeric(test),
         value2=node_numeric(test),
         value3=node_numeric(test),
         value4=node_numeric(test))
res <- ggraph(g) +
  geom_node_rect(aes(value1=value1)) +
  geom_node_rect(aes(value2=value2, xmin=xmin+width/4))+
  geom_node_rect(aes(value3=value3, xmin=xmin+2*width/4))+
  geom_node_rect(aes(value4=value4, xmin=xmin+3*width/4))+
  overlay_raw_map() + theme_void() +
  scale_fill_multi(aesthetics = c("value1", "value2",
                                  "value3", "value4"),
                   name = list("Condition1",
                               "Condition2",
                               "Condition3",
                               "Condition4"),
                   colours = list(
                     scales::brewer_pal(palette = "YlGnBu")(6),
                     scales::brewer_pal(palette = "RdPu")(6),
                     scales::brewer_pal(palette = "PuOr")(6),
                     scales::brewer_pal(palette = "RdBu")(6)
                   ),
                   guide = guide_colorbar(barheight = unit(50, "pt")))
resModule
模块信息可以获取并解析。支持对 DEFINITION 和 REACTION 的解析。对于定义,首先函数将定义分解为块,并使用 ggraph 和 tbl_graph 或使用 geom_text 和 geom_rect 进行文本本身的图形表示。通过调用 module 函数,创建 kegg_module 类对象。
使用到的包
library(ggkegg)
library(tidygraph)
library(dplyr)
mod <- module("M00004")
mod
#> M00004
#> Pentose phosphate pathway (Pentose phosphate cycle)
module函数创建一个 kegg_module 类的对象,该对象在其内部槽中存储了反应和定义的解析信息。通过将这个 kegg_module 对象提供给各种函数,可以执行与模块相关的各种操作。
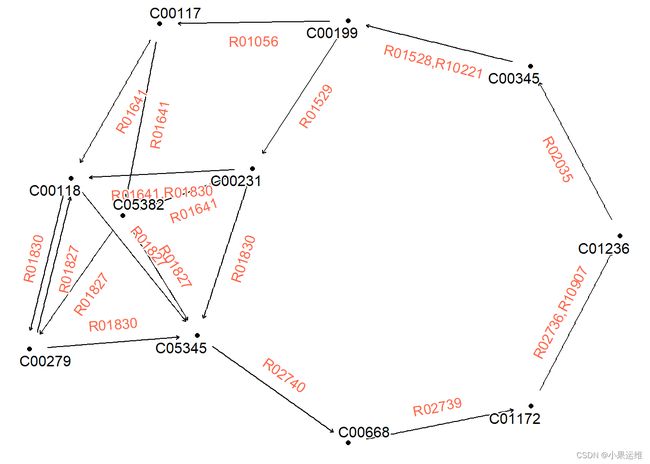
可视化模块中的反应。请报告无法以正确方式解析的任何反应。
library(igraph)
mod <- module("M00004")
## Obtain reaction graph
reacg <- attr(mod, "reaction_graph") # or, get_module_attribute()
## Some edges are duplicate and have different reactions,
## so simplify
reacg |>
    convert(to_simple) |>
    activate(edges) |>
    mutate(reaction=lapply(.orig_data,
        function(x)
            paste0(unique(x[["reaction"]]),
                collapse=","))) |>
    ggraph()+
        geom_node_point()+
        geom_edge_parallel(
            aes(label=reaction), angle_calc = "along",
            label_dodge = unit(5,"mm"),
            label_colour = "tomato",
            arrow = arrow(length = unit(1, 'mm')),
            end_cap = circle(5, 'mm'),
            start_cap = circle(5, "mm"))+
        geom_node_text(aes(label=name), repel=TRUE,
            bg.colour="white", size=4)+
theme_void()Network
解析 KEGG NETWORK 并以相同的方式绘制成网络。在这种情况下,使用 network 函数。
library(ggkegg)
library(tidygraph)
library(dplyr)
kne <- network("N00002")
kne
#> N00002
#> BCR-ABL fusion kinase to RAS-ERK signaling pathway
Combining multiple networks
合并多个网络
以下是获取多个网络、使用 graph_join 合并它们,并使用 plot_kegg_network 包装函数绘制它们的示例。network_graph 函数是一个根据字符串生成图形的函数。可以指定 definition 或 expanded 作为类型来生成图形。
kne <- network("N00385")  ## HCMV
kne2 <- network("N00366") ## HPV
one <- kne |> network_graph()
two <- kne2 |> network_graph()
two
#> # A tbl_graph: 6 nodes and 5 edges
#> #
#> # A rooted tree
#> #
#> # A tibble: 6 × 3
#>   name     network_name                          network_ID
#>
#> 1 E5       HPV E5 to EGFR-PI3K signaling pathway N00366
#> 2 V-ATPase HPV E5 to EGFR-PI3K signaling pathway N00366
#> 3 EGFR     HPV E5 to EGFR-PI3K signaling pathway N00366
#> 4 PI3K     HPV E5 to EGFR-PI3K signaling pathway N00366
#> 5 PIP3     HPV E5 to EGFR-PI3K signaling pathway N00366
#> 6 AKT      HPV E5 to EGFR-PI3K signaling pathway N00366
#> #
#> # A tibble: 5 × 4
#>    from    to type  subtype
#>
#> 1     1     2 -|    reference
#> 2     2     3 -|    reference
#> 3     3     4 ->    reference
#> # ℹ 2 more rows
graph_join(one, two, by="name") |> plot_kegg_network()
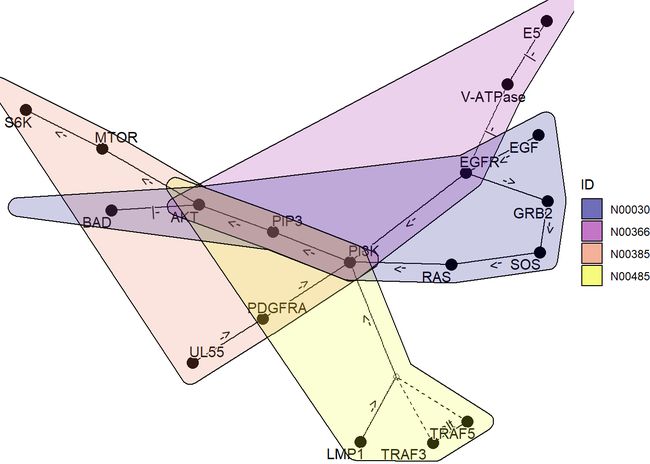
通过使用 ggforce,可以绘制多个图表,显示哪些基因属于哪个网络。
kne3 <- network("N00485") ## EBV
kne4 <- network("N00030") ## EGF-EGFR-RAS-PI3K
three <- kne3 |> network_graph()
four <- kne4 |> network_graph()

gg <- Reduce(function(x,y) graph_join(x,y, by="name"), list(one, two, three, four))
coln <- gg |> activate(nodes) |> data.frame() |> colnames()
nids <- coln[grepl("network_ID",coln)]

net <- plot_kegg_network(gg)
for (i in nids) {
  net <- net + ggforce::geom_mark_hull(alpha=0.2, aes(group=.data[[i]],
    fill=.data[[i]], x=x, y=y, filter=!is.na(.data[[i]])))
}
net + scale_fill_manual(values=viridis::plasma(4), name="ID")


