openlayer 加载高德地图(EPSG:3857)和GeoJSON图层(EPSG:4326)
概述
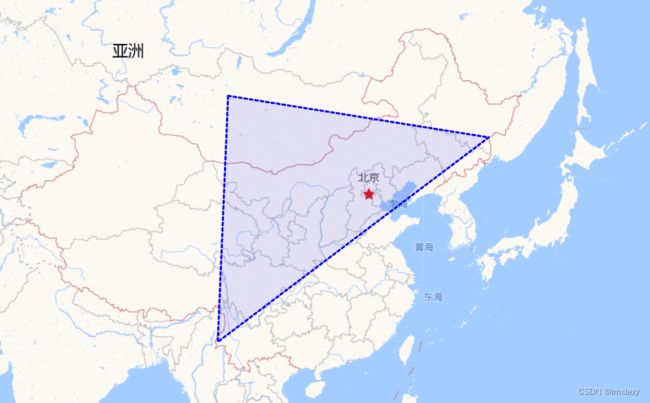
基于openlayer实现高德底图(墨卡托投影,3857)和GeoJSON图层(4326坐标系)的叠加显示,并实现GeoJSON图层的数据变换。
一、效果展示
二、代码实现
DOCTYPE html>
<html lang="en">

<head>
    <meta charset="UTF-8">
    <meta http-equiv="X-UA-Compatible" content="IE=edge">
    <meta name="viewport" content="width=device-width, initial-scale=1.0">
    <script src="https://cdnjs.cloudflare.com/ajax/libs/openlayers/8.1.0/dist/ol.min.js"
        integrity="sha512-Lu3mKY4gbgocyIAil/7VhNwTSQuvpcLwDyaNz2yhCymG1GiV98pcRsfePdAK7EarOsKHtEMYjhrAt4brBu3HuQ=="
        crossorigin="anonymous" referrerpolicy="no-referrer">script>
    <title>Documenttitle>

    <style>
        body {
            position: absolute;
            left: 0;
            top: 0;
            bottom: 0;
            right: 0;
        }
    style>
head>

<body>
    <div id="map" style="position: absolute; top: 0; bottom: 0;left: 0;right: 0;">div>
    <button onclick="change()" style="position: absolute;right: 0;">切换button>

    <script>
        const g1 = {
            "type": "FeatureCollection",
            "features": [
                {
                    "type": "Feature",
                    "properties": {},
                    "geometry": {
                        "coordinates": [
                            [
                                [
                                    99.14453010126164,
                                    48.37188442411559
                                ],
                                [
                                    97.87651995929195,
                                    24.516998554896134
                                ],
                                [
                                    131.05611867416263,
                                    44.890699146088735
                                ],
                                [
                                    99.14453010126164,
                                    48.37188442411559
                                ]
                            ]
                        ],
                        "type": "Polygon"
                    }
                }
            ]
        }

        const g2 = {
            "type": "FeatureCollection",
            "features": [
                {
                    "type": "Feature",
                    "properties": {},
                    "geometry": {
                        "coordinates": [
                            [
                                [
                                    114.30097113146928,
                                    36.88500539407568
                                ],
                                [
                                    110.76935572148994,
                                    33.1312347399369
                                ],
                                [
                                    121.18698921009167,
                                    31.225425500546166
                                ],
                                [
                                    119.76977567196718,
                                    36.82254367773106
                                ],
                                [
                                    114.30097113146928,
                                    36.88500539407568
                                ]
                            ]
                        ],
                        "type": "Polygon"
                    }
                }
            ]
        }

        // geojson source and layer
        var vectorSource = new ol.source.Vector({
            features: (new ol.format.GeoJSON({ featureProjection: 'EPSG:3857' })).readFeatures(g2)
        })

        var vectorLayer = new ol.layer.Vector({
            source: vectorSource,
            style: new ol.style.Style({
                stroke: new ol.style.Stroke({
                    color: 'blue',
                    lineDash: [4],
                    width: 3,
                }),
                fill: new ol.style.Fill({
                    color: 'rgba(0, 0, 255, 0.1)',
                }),
            })
        })

        // gaode map
        var gaodeMap = new ol.source.XYZ({
            url: 'http://webrd0{1-4}.is.autonavi.com/appmaptile?lang=zh_cn&size=1&scale=1&style=8&x={x}&y={y}&z={z}',
            wrapX: false
        })
        var gaodeLayer = new ol.layer.Tile({
            source: gaodeMap,
        })

        var map = new ol.Map({
            target: 'map',
            layers: [
                gaodeLayer,
                vectorLayer
            ],
            view: new ol.View({
                center: ol.proj.fromLonLat([114.30097113146928, 36.88500539407568]),
                zoom: 5
            })
        })

        function change() {
            vectorSource.clear()
            vectorSource.addFeatures((new ol.format.GeoJSON({ featureProjection: 'EPSG:3857' })).readFeatures(g1))
        }
    script>
body>

html>