echarts饼图扇形之间设置间距
查看文档以及网上查找,都是将边框颜色设置成和背景色一样,但是当背景是图片的时候就不适用了,试了很多方式都不理想,没办法只能从数据上下手了,最终效果如下图,
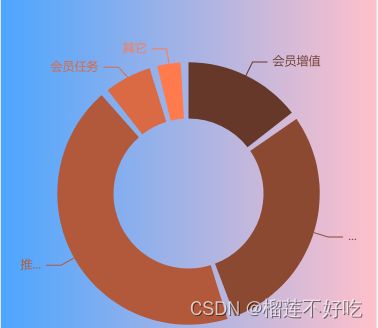
思路:将list中的数据每一条后面插入一条数据,数量根据总量计算,颜色为透明,处理如下
// 原始数据和颜色
const  list = [...]
const color = [...]
// 计算插入的数据的值,更改100的数值调整间距的大小
let gap = (list.reduce((a, b) => a + Number(b.ValueAmount), 0) || 0) / 100;

// 重新组织数据
const newlist = []
list.forEach((f, fi) => {
    newlist .push({name: f.TypeName,value: f.ValueAmount,label: { color: color[fi] },itemStyle: { color: color[fi] }});
    // 插入一条新的颜色透明的数据用来占位
    newlist .push({name: "",value: gap, label: { color: "rgba(0, 0, 0, 0)" },itemStyle: { color: "rgba(0, 0, 0, 0)" }})
})
完整代码
<div id="container" style="width: 100%;height: 100%">div>

<script>
function echart(list) {
  var myChart = echarts.init(document.getElementById('container'));
  var option = {
    series: [
      {
        type: 'pie',
        radius: ['40%', '70%'],
        data: list,
        selectedMode: 'single',
      }
    ]
  };
  myChart.setOption(option);
  return myChart
}


// 原始数据和颜色
const  list = [
  {TypeName: "会员增值", ValueAmount: 100},
  {TypeName: "平台消费", ValueAmount: 200},
  {TypeName: "推广奖励", ValueAmount: 300},
  {TypeName: "会员任务", ValueAmount: 40},
  {TypeName: "其它", ValueAmount: 20 },
]
const color = ['#663829', '#8C4932', '#B3593B', '#D96A44', '#FF7A4D',]
// 计算插入的数据的值
let gap = (list.reduce((a, b) => a + Number(b.ValueAmount), 0) || 0) / 100;

// 重新组织数据
const newlist = []
list.forEach((f, fi) => {
	newlist .push({name: f.TypeName,value: f.ValueAmount,label: { color: color[fi] },itemStyle: { color: color[fi] }});
	// 插入一条新的颜色透明的数据用来占位
	newlist .push({name: "",value: gap, label: { color: "rgba(0, 0, 0, 0)" },itemStyle: { color: "rgba(0, 0, 0, 0)" }})
})

echart(newlist )
script>
以上为临时解决方案,如有更好的方法,可以一起交流下