mysql死锁排查
- 查看正在进行中的事务
SELECT * FROM information_schema.INNODB_TRX;
| 字段 | 解释 |
|---|---|
| trx_id | 唯一事务id号,只读事务和非锁事务是不会创建id的 |
| trx_state | 事务的执行状态,值一般分为:RUNNING, LOCK WAIT, ROLLING BACK, and COMMITTING. |
| trx_started | 事务的开始时间 |
| trx_requested_lock_id | 如果trx_state是lock wait,显示事务当前等待锁的id,不是则为空。想要获取锁的信息,根据该lock_id,以innodb_locks表中lock_id列匹配条件进行查询,获取相关信息。 |
| trx_wait_started | 如果trx_state是lock wait,该值代表事务开始等待锁的时间;否则为空。 |
| trx_weight | 事务的高度,代表修改的行数(不一定准确)和被事务锁住的行数。为了解决死锁,innodb会选择一个高度最小的事务来当做牺牲品进行回滚。已经被更改的非交易型表的事务权重比其他事务高,即使改变的行和锁住的行比其他事务低。 |
| trx_mysql_thread_id | mysql线程id。想要获取该线程的信息,根据该thread_id,以information_schema.processlist表的id列为匹配条件进行查询。 |
| trx_query | 事务正在执行的sql语句。 |
| trx_operation_state | 事务当前的操作状态,没有则为空。 |
| trx_tables_in_use | 事务在处理当前sql语句使用innodb引擎表的数量。 |
| trx_tables_locked | 当前sql语句有行锁的innodb表的数量。(因为只是行锁,不是表锁,表仍然可以被多个事务读和写) |
| trx_lock_structs | 事务保留锁的数量。 |
| trx_lock_memory_bytes | 在内存中事务索结构占得空间大小。 |
| trx_rows_locked | 事务行锁最准确的数量。这个值可能包括对于事务在物理上存在,实际不可见的删除标记的行。 |
| trx_rows_modified | 事务修改和插入的行数 |
| trx_concurrency_tickets | 该值代表当前事务在被清掉之前可以多少工作,由 innodb_concurrency_tickets系统变量值指定。 |
| trx_isolation_level | 事务隔离等级。 |
| trx_unique_checks | 当前事务唯一性检查启用还是禁用。当批量数据导入时,这个参数是关闭的。 |
| trx_foreign_key_checks | 当前事务的外键坚持是启用还是禁用。当批量数据导入时,这个参数是关闭的。 |
| trx_last_foreign_key_error | 最新一个外键错误信息,没有则为空。 |
| trx_adaptive_hash_latched | 自适应哈希索引是否被当前事务阻塞。当自适应哈希索引查找系统分区,一个单独的事务不会阻塞全部的自适应hash索引。自适应hash索引分区通过 innodb_adaptive_hash_index_parts参数控制,默认值为8。 |
| trx_adaptive_hash_timeout | 是否为了自适应hash索引立即放弃查询锁,或者通过调用mysql函数保留它。当没有自适应hash索引冲突,该值为0并且语句保持锁直到结束。在冲突过程中,该值被计数为0,每句查询完之后立即释放门闩。当自适应hash索引查询系统被分区(由 innodb_adaptive_hash_index_parts参数控制),值保持为0。 |
| trx_is_read_only | 值为1表示事务是read only。 |
| trx_autocommit_non_locking | 值为1表示事务是一个select语句,该语句没有使用for update或者shared mode锁,并且执行开启了autocommit,因此事务只包含一个语句。当TRX_AUTOCOMMIT_NON_LOCKING和TRX_IS_READ_ONLY同时为1,innodb通过降低事务开销和改变表数据库来优化事务。 |
- 查看正在锁的事务
SELECT * FROM information_schema.INNODB_LOCKS;
| 字段 | 解释 |
|---|---|
| lock_id | innodb唯一lock id。把他当做一个不透明的字符串。虽然lock_id当前包含trx_id,lock_id的数据格式在任何时间都肯能改变。不要写用于解析lock_id值得应用程序。 |
| lock_trx_id | 持有锁的事务id。查询事务信息,与innodb_trx表中trx_id列匹配。 |
| lock_mode | 锁请求。该值包括: S, X, IS, IX, GAP, AUTO_INC, and UNKNOWN。锁模式标识符可以组合用于识别特定的锁模式。查看更多信息,点击此处 |
| lock_type | 锁类型。行锁为record,表锁为table。 |
| lock_table | 被锁的表名,或者包含锁记录的表名。 |
| lock_index | lock_type为行锁时,该值为索引名,否则为空。 |
| lock_space | lock_type为行锁时,该值为锁记录的表空间的id,否则为空。 |
| lock_page | lock_type为行锁时,该值为锁记录页数量,否则为空。 |
| lock_rec | lock_type为行锁时,页内锁记录的堆数,否则为空。 |
| lock_data | 与锁相关的数据。如果lock_type为行锁时,该值是锁记录的主键值,否则为空。这列包含锁定行的主键列的值,转化为一个有效的字符串,如果没有主键,lock_data是唯一innodb内部行id号。如果是键值或者范围大于索引的最大值会使用间隙锁,lock_data表示为supremum pseudo-record。当包含锁记录的页不在buffer pool内,innodb不去从磁盘获取页,为了避免不必要的磁盘操作,lock_data为空。 |
- 查看等待锁的事务
SELECT * FROM information_schema.INNODB_LOCK_WAITS;
| 字段 | 解释 |
|---|---|
| requesting_trx_id | 请求(阻止)事务的ID。 |
| requested_lock_id | 事务正在等待的锁的ID。 |
| blocking_trx_id | 阻止事务的ID。 |
| blocking_lock_id | 由阻止另一个事务继续进行的事务所持有的锁的ID |
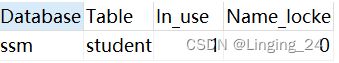
- 显示当前被锁定的表的列表
SHOW OPEN TABLES where In_use > 0;
| 字段 | 解释 |
|---|---|
| Database | 数据库名称 |
| Table | 表名称 |
| In_use | 表示有多少线程正在使用某张表 |
| Name_locked | 表名是否被锁,这一般发生在Drop或Rename命令操作这张表时 |
- 查看InnoDB存储引擎的状态信息,包括在途事务、锁、缓冲池和日志文件等。
show engine innodb status;
| 字段 | 解释 |
|---|---|
| InnoDB | 存储引擎 |
| Name | |
| Status | 最近一次事务、锁、缓存池的日志信息 |
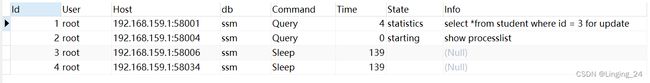
- 显示用户正在运行的线程
show processlist;
| 字段 | 解释 |
|---|---|
| Id | 这个线程的唯一标识,当我们发现这个线程有问题的时候,可以通过 kill 命令,加上这个Id值将这个线程杀掉。 |
| User | 指启动这个线程的用户。 |
| Host | 记录了发送请求的客户端的 IP 和 端口号。通过这些信息在排查问题的时候,我们可以定位到是哪个客户端的哪个进程发送的请求。 |
| db | 当前执行的命令是在哪一个数据库上。如果没有指定数据库,则该值为 NULL 。 |
| Command | 指此刻该线程正在执行的命令。 |
| Time | 表示该线程处于当前状态的时间。 |
| State | 线程的状态,和Command对应。 |
| Info | 一般记录的是线程执行的语句。默认只显示前100个字符,也就是你看到的语句可能是截断了的,要看全部信息,需要使用 show full processlist。 |
死锁的内部处理方案:
- 死锁探测机制
innodb_deadlock_detect默认开启,会自动回滚其中一个事务 - 锁等待超时机制
innodb_lock_wait_timeout默认50s锁超时自定释放
死锁分析:
表中数据:student
| id | name | age |
|---|---|---|
| 1 | linging | 20 |
| 2 | zhangsan | 30 |
| 3 | lisi | 15 |
| 事务14360 | 事务14361 |
|---|---|
| begin | begin |
| ①select *from student where id = 2 for update; | |
| ②select *from student where id = 3 for update; | |
| ③select *from student where id = 3 for update; | |
| ④select *from student where id = 2 for update; | |
执行完①②语句时:
查看事务:SELECT * FROM information_schema.INNODB_TRX
![]()
接着执行③:
查看正在运行的事务:SELECT * FROM information_schema.INNODB_TRX
![]()
查看正在锁的事务:SELECT * FROM information_schema.INNODB_LOCKS
![]()
查看等待锁的事务:SELECT * FROM information_schema.INNODB_LOCK_WAITS

显示当前被锁定的表的列表:SHOW OPEN TABLES where In_use > 0
查看线程列表:show processlist;
如果此时什么也不做,那么事务14360的语句③在等待事务14361的语句②释放X锁,等待50s之后,锁超时释放:
![]()
这时如果执行事务14361的语句④,那么出现死锁,mysql自动进行死锁检测,检测之后回滚其中的一个事务
![]()
查看正在运行的事务:SELECT * FROM information_schema.INNODB_TRX
![]()
可以看到,事务14361被回滚了。
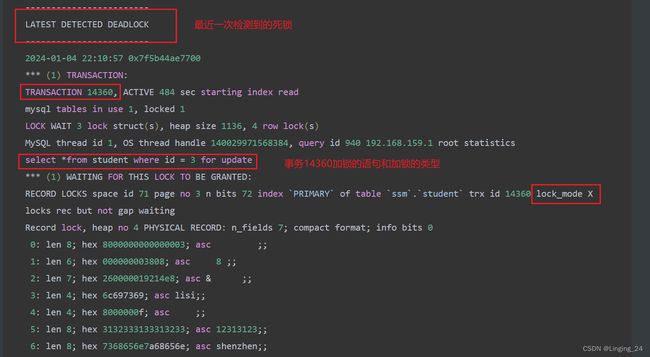
查看最近一次死锁的日志:show engine innodb status;
=====================================
2024-01-04 22:14:15 0x7f5b44b28700 INNODB MONITOR OUTPUT
=====================================
Per second averages calculated from the last 0 seconds
-----------------
BACKGROUND THREAD
-----------------
srv_master_thread loops: 14 srv_active, 0 srv_shutdown, 3577 srv_idle
srv_master_thread log flush and writes: 3591
----------
SEMAPHORES
----------
OS WAIT ARRAY INFO: reservation count 14
OS WAIT ARRAY INFO: signal count 14
Mutex spin waits 0, rounds 0, OS waits 0
RW-shared spins 13, rounds 25, OS waits 12
RW-excl spins 0, rounds 22543, OS waits 0
RW-sx spins 0, rounds 0, OS waits 0
Spin rounds per wait: 0.00 mutex, 1.92 RW-shared, 22543.00 RW-excl, 0.00 RW-sx
------------------------
LATEST DETECTED DEADLOCK
------------------------
2024-01-04 22:10:57 0x7f5b44ae7700
*** (1) TRANSACTION:
TRANSACTION 14360, ACTIVE 484 sec starting index read
mysql tables in use 1, locked 1
LOCK WAIT 3 lock struct(s), heap size 1136, 4 row lock(s)
MySQL thread id 1, OS thread handle 140029971568384, query id 940 192.168.159.1 root statistics
select *from student where id = 3 for update
*** (1) WAITING FOR THIS LOCK TO BE GRANTED:
RECORD LOCKS space id 71 page no 3 n bits 72 index `PRIMARY` of table `ssm`.`student` trx id 14360 lock_mode X locks rec but not gap waiting
Record lock, heap no 4 PHYSICAL RECORD: n_fields 7; compact format; info bits 0
0: len 8; hex 8000000000000003; asc ;;
1: len 6; hex 000000003808; asc 8 ;;
2: len 7; hex 260000019214e8; asc & ;;
3: len 4; hex 6c697369; asc lisi;;
4: len 4; hex 8000000f; asc ;;
5: len 8; hex 3132333133313233; asc 12313123;;
6: len 8; hex 7368656e7a68656e; asc shenzhen;;
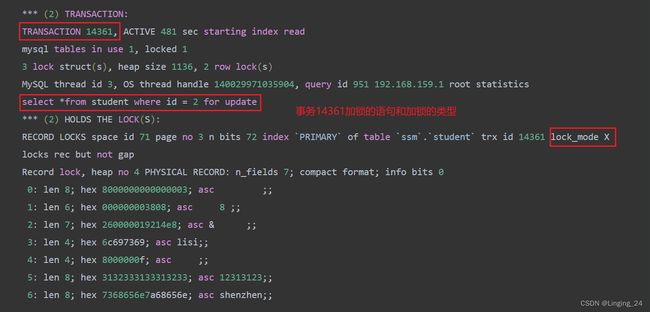
*** (2) TRANSACTION:
TRANSACTION 14361, ACTIVE 481 sec starting index read
mysql tables in use 1, locked 1
3 lock struct(s), heap size 1136, 2 row lock(s)
MySQL thread id 3, OS thread handle 140029971035904, query id 951 192.168.159.1 root statistics
select *from student where id = 2 for update
*** (2) HOLDS THE LOCK(S):
RECORD LOCKS space id 71 page no 3 n bits 72 index `PRIMARY` of table `ssm`.`student` trx id 14361 lock_mode X locks rec but not gap
Record lock, heap no 4 PHYSICAL RECORD: n_fields 7; compact format; info bits 0
0: len 8; hex 8000000000000003; asc ;;
1: len 6; hex 000000003808; asc 8 ;;
2: len 7; hex 260000019214e8; asc & ;;
3: len 4; hex 6c697369; asc lisi;;
4: len 4; hex 8000000f; asc ;;
5: len 8; hex 3132333133313233; asc 12313123;;
6: len 8; hex 7368656e7a68656e; asc shenzhen;;
*** (2) WAITING FOR THIS LOCK TO BE GRANTED:
RECORD LOCKS space id 71 page no 3 n bits 72 index `PRIMARY` of table `ssm`.`student` trx id 14361 lock_mode X locks rec but not gap waiting
Record lock, heap no 3 PHYSICAL RECORD: n_fields 7; compact format; info bits 0
0: len 8; hex 8000000000000002; asc ;;
1: len 6; hex 00000000380a; asc 8 ;;
2: len 7; hex 27000001932072; asc ' r;;
3: len 8; hex 7a68616e6773616e; asc zhangsan;;
4: len 4; hex 8000001e; asc ;;
5: len 8; hex 3132333133313233; asc 12313123;;
6: len 8; hex 7368656e7a68656e; asc shenzhen;;
*** WE ROLL BACK TRANSACTION (2)
------------
TRANSACTIONS
------------
Trx id counter 14362
Purge done for trx's n:o < 14350 undo n:o < 0 state: running but idle
History list length 392
LIST OF TRANSACTIONS FOR EACH SESSION:
---TRANSACTION 421505098215608, not started
0 lock struct(s), heap size 1136, 0 row lock(s)
---TRANSACTION 421505098214760, not started
0 lock struct(s), heap size 1136, 0 row lock(s)
---TRANSACTION 421505098213912, not started
0 lock struct(s), heap size 1136, 0 row lock(s)
---TRANSACTION 14360, ACTIVE 682 sec
3 lock struct(s), heap size 1136, 4 row lock(s)
MySQL thread id 1, OS thread handle 140029971568384, query id 958 192.168.159.1 root cleaning up
--------
FILE I/O
--------
I/O thread 0 state: waiting for completed aio requests (insert buffer thread)
I/O thread 1 state: waiting for completed aio requests (log thread)
I/O thread 2 state: waiting for completed aio requests (read thread)
I/O thread 3 state: waiting for completed aio requests (read thread)
I/O thread 4 state: waiting for completed aio requests (read thread)
I/O thread 5 state: waiting for completed aio requests (read thread)
I/O thread 6 state: waiting for completed aio requests (write thread)
I/O thread 7 state: waiting for completed aio requests (write thread)
I/O thread 8 state: waiting for completed aio requests (write thread)
I/O thread 9 state: waiting for completed aio requests (write thread)
Pending normal aio reads: 0 [0, 0, 0, 0] , aio writes: 0 [0, 0, 0, 0] ,
ibuf aio reads: 0, log i/o's: 0, sync i/o's: 0
Pending flushes (fsync) log: 0; buffer pool: 0
670 OS file reads, 187 OS file writes, 54 OS fsyncs
0.00 reads/s, 0 avg bytes/read, 0.00 writes/s, 0.00 fsyncs/s
-------------------------------------
INSERT BUFFER AND ADAPTIVE HASH INDEX
-------------------------------------
Ibuf: size 1, free list len 0, seg size 2, 0 merges
merged operations:
insert 0, delete mark 0, delete 0
discarded operations:
insert 0, delete mark 0, delete 0
Hash table size 276671, node heap has 2 buffer(s)
0.00 hash searches/s, 0.00 non-hash searches/s
---
LOG
---
Log sequence number 8937219
Log flushed up to 8937219
Pages flushed up to 8937219
Last checkpoint at 8937210
0 pending log flushes, 0 pending chkp writes
38 log i/o's done, 0.00 log i/o's/second
----------------------
BUFFER POOL AND MEMORY
----------------------
Total large memory allocated 137494528
Dictionary memory allocated 361089
Buffer pool size 8191
Free buffers 7785
Database pages 404
Old database pages 0
Modified db pages 0
Pending reads 0
Pending writes: LRU 0, flush list 0, single page 0
Pages made young 0, not young 0
0.00 youngs/s, 0.00 non-youngs/s
Pages read 369, created 35, written 135
0.00 reads/s, 0.00 creates/s, 0.00 writes/s
No buffer pool page gets since the last printout
Pages read ahead 0.00/s, evicted without access 0.00/s, Random read ahead 0.00/s
LRU len: 404, unzip_LRU len: 0
I/O sum[0]:cur[0], unzip sum[0]:cur[0]
--------------
ROW OPERATIONS
--------------
0 queries inside InnoDB, 0 queries in queue
0 read views open inside InnoDB
Process ID=1, Main thread ID=140029846894336, state: sleeping
Number of rows inserted 3, updated 3, deleted 0, read 51
0.00 inserts/s, 0.00 updates/s, 0.00 deletes/s, 0.00 reads/s
----------------------------
END OF INNODB MONITOR OUTPUT
============================
分析日志: