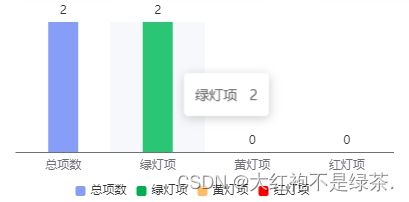
- legend里data和series里的name需要对应
- series里对象需要设置stack属性,属性值都一样即可
- 显示单柱重点在于series里对象data属性设置,必须使用'',否则影响柱体上数值显示
- tooltip的值需要自定义,否则会显示堆叠柱状图的tooltip格式,非图中所示
drawSingleBarChart() {
    let me = this
    // 基于准备好的dom,初始化echarts实例  这个和上面的main对应
    let myChart = echarts.init(document.getElementById('singleBar'))
    let color = ['#879EF9', '#00B050', '#FEBC66', '#FF0000', '#7F7F7F']
    let data = ['总项数', '绿灯项', '黄灯项', '红灯项']
    // 指定图表的配置项和数据
    let option = {
        color: color,
        legend: {
            x: 'center',
            y: 'bottom',
            itemWidth: 10,
            itemHeight: 10,
            data: data,
        },
        tooltip: {
            enabled: true,
            trigger: 'axis',
            formatter: '{a}   {c}
',
            axisPointer: {
                type: 'shadow'
            }
        },
        grid: {
            top: '10%',
            left: '0',
            right: '0',
            bottom: '15%',
            containLabel: true
        },
        xAxis: {
            type: 'category',
            axisTick: {
                show: false
            },
            data: data
        },
        yAxis: {
            type: 'value',
            show: false,
        },
        series: [
            {
              name: '总项数',
              stack: '设备',
              type: 'bar',
              label: {
                  normal: {
                      show: true,
                      position: 'top'
                  }
              },
              barWidth: 30,
              data: [2]
            },
            {
              name: '绿灯项',
              type: 'bar',
              label: {
                 normal: {
                      show: true,
                      position: 'top'
                 }
              },
              barWidth: 30,
              stack: '设备',
              data: ['', 2]
             },
             {
               name: '黄灯项',
               type: 'bar',
               label: {
                   normal: {
                       show: true,
                       position: 'top'
                   }
               },
               barWidth: 30,
               stack: '设备',
               data: ['', '', 0]
             },
             {
                name: '红灯项',
                type: 'bar',
                label: {
                   normal: {
                       show: true,
                       position: 'top'
                   }
                },
                barWidth: 30,
                stack: '设备',
                data: ['', '', '', 0]
              }
           ]
        }
        // 使用刚指定的配置项和数据显示图表。
        myChart.setOption(option)
},
