echarts---x轴数据过多,设置x轴左右滑动显示
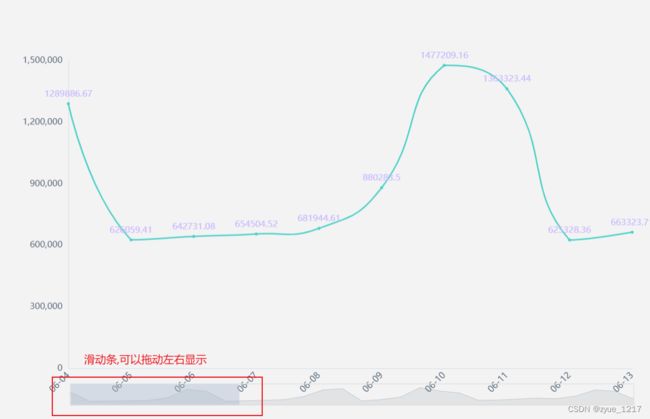
显示滑动条的左右滑动显示
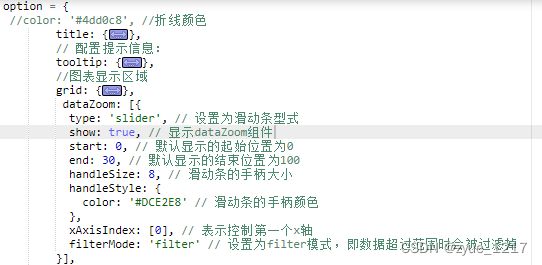
        dataZoom: [{
          type: 'slider', // 设置为滑动条型式
          show: true, // 显示dataZoom组件
          start: 0, // 默认显示的起始位置为0
          end: 30, // 默认显示的结束位置为100
          handleSize: 8, // 滑动条的手柄大小
          handleStyle: {
            color: '#DCE2E8' // 滑动条的手柄颜色
          },
          xAxisIndex: [0], // 表示控制第一个x轴
          filterMode: 'filter' // 设置为filter模式,即数据超过范围时会被过滤掉
        }],
          axisLabel: {
            rotate: 45, // X 轴标签文字旋转角度
            //坐标轴刻度标签的显示间隔,在类目轴中有效。默认会采用标签不重叠的策略间隔显示标签。可以设置成 0 强制显示所有标签。
            interval: 0,
            textStyle: {
              color: "#556677",
            },
            fontSize: 12,
            formatter: function (value, index) {
              if (index >= 12) {
                return ''; // 超过12条数据的标签不显示
              } else {
                return value;
              }
            }
          },
option = {
 //color: '#4dd0c8', //折线颜色
        title: {
          text: '标题'
        },
        // 配置提示信息:
        tooltip: {
          trigger: 'axis',
          axisPointer: { // 坐标轴指示器配置项。
            type: 'cross', // 'line' 直线指示器  'shadow' 阴影指示器  'none' 无指示器  'cross' 十字准星指示器。
            axis: 'auto', // 指示器的坐标轴。
            snap: true, // 坐标轴指示器是否自动吸附到点上
          },
          showContent: true,
        },
        //图表显示区域
        grid: {
          top: '20%',
          left: '3%',
          right: '4%',
          bottom: '3%',
          // 显示边框
          show: false,
          containLabel: true
        },
         dataZoom: [{
          type: 'slider', // 设置为滑动条型式
          show: true, // 显示dataZoom组件
          start: 0, // 默认显示的起始位置为0
          end: 30, // 默认显示的结束位置为100
          handleSize: 8, // 滑动条的手柄大小
          handleStyle: {
            color: '#DCE2E8' // 滑动条的手柄颜色
          },
          xAxisIndex: [0], // 表示控制第一个x轴
          filterMode: 'filter' // 设置为filter模式,即数据超过范围时会被过滤掉
        }],
        xAxis: {
          type: 'category',
          axisTick: {
            show: false
          },
          axisLine: {
            show: true, //去除轴线
            lineStyle: {
              color: "#DCE2E8",//设置x轴轴线颜色
            }
          },
          axisLabel: {
            rotate: 45, // X 轴标签文字旋转角度
            //坐标轴刻度标签的显示间隔,在类目轴中有效。默认会采用标签不重叠的策略间隔显示标签。可以设置成 0 强制显示所有标签。
            interval: 0,
            textStyle: {
              color: "#556677",
            },
            fontSize: 12,
            formatter: function (value, index) {
              if (index >= 12) {
                return ''; // 超过12条数据的标签不显示
              } else {
                return value;
              }
            }
          },
          boundaryGap: false, //去除轴间距
          data: ['06-04', '06-05', '06-06', '06-07', '06-08', '06-09', '06-10', '06-11', '06-12', '06-13', '06-14', '06-15', '06-16', '06-17', '06-18', '06-19', '06-20', '06-21', '06-22', '06-23', '06-24', '06-25', '06-26', '06-27', '06-28', '06-29', '06-30', '07-01', '07-02', '07-03'],
        },
        yAxis: {
          type: 'value',
          axisTick: {
            show: false,  //去除y轴刻度线
          },
          axisLabel: {
            textStyle: {
              color: "#556677",
            },
          },
          axisLine: {
            show: true,  //显示y轴轴线
            lineStyle: {
              color: "#DCE2E8",
            },
          },
          splitLine: {
            //坐标轴在 grid 区域中的分隔线。
            show: false,
          }
        },
        series: [{
          data:[1289886.67, 626059.41, 642731.08, 654504.52, 681944.61, 880283.5, 1477209.16, 1363323.44, 625328.36, 663323.71, 699980.69, 742812.11, 967688.17, 1446161.37, 1543749.14, 646472.84, 748964.15, 936463.81, 1612093.01, 1371712.41, 1233419.16, 702205.29, 712268.52, 783523.87, 854010, 813679.34, 1000449.75, 1448029.06, 1353368.1, 782741.25],
          type: 'line',
          smooth: true,
          symbol: 'circle',
          itemStyle: {
            normal: {
              label: {
                show: true,
                textStyle: {
                  color: '#cab8fe'  //折线点上对应字体颜色
                }
              },
              // lineStyle: {
              //   color: 'rgba(0,0,0,0)'// 折线颜色设置为0,即只显示点,不显示折线
              // },
              color: "#4dd0c8",  //折线点颜色  #fc5531
            }
          },
        }]
};
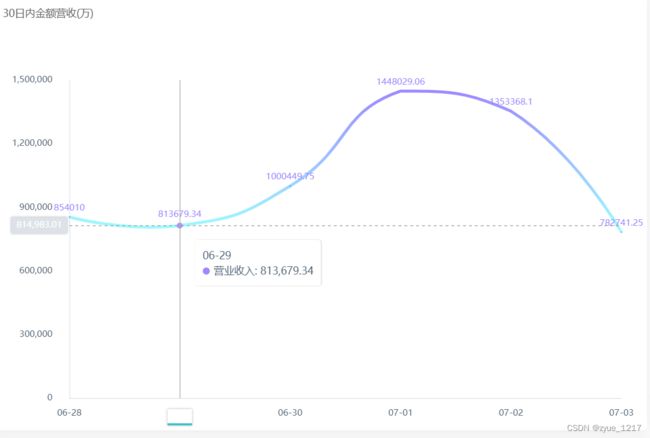
不显示滑动条的左右滑动显示
option = {
        title: {
          text: '30日内金额营收(万)',
          textStyle: {
            top: 10,
            color: "#616161", //颜色
            fontStyle: "normal", //风格
            fontWeight: "normal", //粗细
            fontFamily: "Microsoft yahei", //字体
            fontSize: 14, //大小
            align: "center", //水平对齐
          },
          left: "1%",
          top: "3%",
        },
        // 配置提示信息:
        tooltip: {
          show: true,
          trigger: 'axis',
          axisPointer: { // 坐标轴指示器配置项。
            type: 'cross', // 'line' 直线指示器  'shadow' 阴影指示器  'none' 无指示器  'cross' 十字准星指示器。
            axis: 'auto', // 指示器的坐标轴。
            snap: true, // 坐标轴指示器是否自动吸附到点上
          },
          extraCssText: "box-shadow: 1px 0 2px 0 rgba(163,163,163,0.5)",
          padding: 10,
          backgroundColor: '#fff',
          textStyle: {
            color: '#556677',
          },
          showContent: true,
        },
        // 图例配置选项  即左上角标签
        // legend: {
        //   data: legend
        // },
        //图表显示区域
        grid: {
          top: '20%',
          left: '3%',
          right: '4%',
          bottom: '3%',
          // 显示边框
          show: false,
          containLabel: true
        },
        dataZoom: [
          {
            show: false,
            startValue: '06-28',  //起始数据
          },
          {
            zoomOnMouseWheel: false,
            type: "inside",
          },
        ],
        xAxis: {
          type: 'category',
          axisTick: {
            show: false
          },
          axisLine: {
            // show: true, //显示轴线
            lineStyle: {
              color: "#DCE2E8",//设置x轴轴线颜色
            }
          },
          axisLabel: {
            // rotate: 0, // X 轴标签文字旋转角度
            //坐标轴刻度标签的显示间隔,在类目轴中有效。默认会采用标签不重叠的策略间隔显示标签。可以设置成 0 强制显示所有标签。
            interval: 0,
            textStyle: {
              color: "#556677",
            },
            fontSize: 12,
            margin: 15,
          },
          axisPointer: {
            label: {
              padding: [0, 0, 10, 0],
              margin: 15,
              fontSize: 12,
              backgroundColor: {
                type: "linear",
                x: 0,
                y: 0,
                x2: 0,
                y2: 1,
                colorStops: [
                  {
                    offset: 0,
                    color: "#fff",
                  },
                  {
                    offset: 0.86,
                    color: "#fff",
                  },
                  {
                    offset: 0.86,
                    color: "#33c0cd",
                  },
                  {
                    offset: 1,
                    color: "#33c0cd",
                  },
                ],
                global: false,
              },
            },
          },
          boundaryGap: false, //去除轴间距
          data:['06-04', '06-05', '06-06', '06-07', '06-08', '06-09', '06-10', '06-11', '06-12', '06-13', '06-14', '06-15', '06-16', '06-17', '06-18', '06-19', '06-20', '06-21', '06-22', '06-23', '06-24', '06-25', '06-26', '06-27', '06-28', '06-29', '06-30', '07-01', '07-02', '07-03'],
        },
        yAxis: {
          type: 'value',
          axisTick: {
            show: false,  //去除y轴刻度线
          },
          axisLabel: {
            padding:[0,15,0,0], //设置y轴文字距离轴线距离
            textStyle: {
              color: "#556677",
            },
          },
          axisLine: {
            show: true,  //显示y轴轴线
            lineStyle: {
              color: "#DCE2E8",
            },
          },
          splitLine: {
            //坐标轴在 grid 区域中的分隔线。
            show: false,
          }
        },
        series: [{
          name: '营业收入',
          data: [1289886.67, 626059.41, 642731.08, 654504.52, 681944.61, 880283.5, 1477209.16, 1363323.44, 625328.36, 663323.71, 699980.69, 742812.11, 967688.17, 1446161.37, 1543749.14, 646472.84, 748964.15, 936463.81, 1612093.01, 1371712.41, 1233419.16, 702205.29, 712268.52, 783523.87, 854010, 813679.34, 1000449.75, 1448029.06, 1353368.1, 782741.25],
          type: 'line',
          smooth: true,
          symbol: 'circle',
          yAxisIndex: 0,
          symbolSize: 1,
          showSymbol: true,
          lineStyle: {
            width: 4,
            // 设置折线颜色渐变
            color: new echarts.graphic.LinearGradient(0, 1, 0, 0, [
              {
                offset: 0,
                color: '#9effff', // 开始位置颜色
              },
              {
                offset: 1,
                color: '#9E87FF',// 结束位置颜色
              },
            ]),
            roam: false,
          },
          itemStyle: {
            normal: {
              label: {
                show: true,
                position: "top",
                // textStyle: {
                //   color: '#cab8fe'  //折线点上对应字体颜色
                // }
              },
              // lineStyle: {
              //   color: 'rgba(0,0,0,0)'// 折线颜色设置为0,即只显示点,不显示折线
              // },
              color: "#9E87FF",//折线点颜色  #fc5531
              borderColor: "#9E87FF",
            }
          },
        }]
      }


