C# 生成史密斯圆图 显示阻抗
自定义了一个Smith的类
class Smith
{
private Chart chart1;
private double r;
private double x;
private double[] RJX;
public double X
{
set { x = value / 50; }
get { return r; }
}
public double R
{
set { r = value / 50; }
get { return r; }
}
public Chart Chart
{
set { chart1 = value; }
get { return chart1; }
}
public void SmithShowR(double R, int series) //界面调用series为5
{
r = R / 50;
chart1.Series[5].Points.Clear();
double[] theta = Linespace(-Math.PI, Math.PI, 100);
for (int i = 0; i < theta.Length; i++)
{
chart1.Series[series].Points.AddXY((Math.Cos(theta[i]) / (1 + r) + (r / (1 + r))), Math.Sin(theta[i]) / (1 + r));
}
}
public void SmithShowX(double X)
{
x = X / 50;
chart1.Series[6].Points.Clear();
if (x == 0)
{
chart1.Series[6].Points.AddXY(-1, 0);
chart1.Series[6].Points.AddXY(1, 0);
}
else
{
double[] theta = Linespace(-Math.PI, Math.PI, 100);
for (int i = 0; i < theta.Length; i++)
{
//chart1.Series[5].Points.AddXY((Math.Cos(theta[i]) / (1 + r) + (r / (1 + r))), Math.Sin(theta[i]) / (1 + r));
chart1.Series[6].Points.AddXY(Math.Cos(theta[i]) / x + 1, Math.Sin(theta[i]) / x + 1 / x);
}
}
}
private double[] Linespace(double lo, double hi, double interval)
{
List
for (int i = 0; i < interval + 1; i++)
{
linespace.Add(lo + i * (hi - lo) / interval);
}
return linespace.ToArray();
}
public double[] Intersection(double R, double X)
{
r = R / 50;
x = X / 50;
double[] C = new double[2];
double[] D = new double[2];
double[] E = new double[2];
double[] CenterR = { r / (1 + r), 0 };
if (X == 0)
{
C[0] = (r - 1) / (r + 1);
C[1] = 0;
return C;
}
else
{
double[] CenterX = { 1, 1 / x };
//Vector2 vertical = new Vector2(Convert.ToSingle((CenterR[0] - CenterX[0])), Convert.ToSingle((CenterR[1] - CenterX[1]))); //得到圆心连线 的向量
//float K1 = Convert.ToSingle(CenterR[1] - CenterX[1]) / Convert.ToSingle(CenterR[0]-CenterX[0]); // 圆心连线的斜率
double K1 = (CenterR[1] - CenterX[1]) / (CenterR[0] - CenterX[0]);
double K2 = -1 / K1;
double L = Math.Sqrt((CenterR[1] - CenterX[1]) * (CenterR[1] - CenterX[1]) + (CenterR[0] - CenterX[0]) * (CenterR[0] - CenterX[0]));
if (X > 0)
{
Double AE = (1 / (1 + r) / (1 + r) - 1 / x / x + L * L) / 2 / L;
E[0] = CenterR[0] + AE / L * (1 - r / (1 + r));
E[1] = CenterR[1] + AE / L * (1 / x - 0);
double CE = Math.Sqrt(1 / (1 + r) / (1 + r) - (E[0] - CenterR[0]) * (E[0] - CenterR[0]) - (E[1] - CenterR[1]) * (E[1] - CenterR[1]));
double EF = CE / Math.Sqrt(1 + K2 * K2);
double CF = EF * Math.Abs(K2);
C[0] = E[0] - EF;
C[1] = E[1] + CF;
D[0] = E[0] + EF;
D[1] = E[1] - CF;
return C;
}
else
{
Double AE = (1 / (1 + r) / (1 + r) - 1 / x / x + L * L) / 2 / L;
E[0] = CenterR[0] + AE / L * (1 - r / (1 + r));
E[1] = CenterR[1] + AE / L * (1 / x - 0);
double CE = Math.Sqrt(1 / (1 + r) / (1 + r) - (E[0] - CenterR[0]) * (E[0] - CenterR[0]) - (E[1] - CenterR[1]) * (E[1] - CenterR[1]));
double EF = CE / Math.Sqrt(1 + K2 * K2);
double CF = EF * Math.Abs(K2);
C[0] = E[0] - EF;
C[1] = E[1] - CF;
D[0] = E[0] + EF;
D[1] = E[1] - CF;
return C;
}
}
}
public void ShowIntersection(double R, double X)
{
double[] RJX = Intersection(R, X);
chart1.Series[7].Points.AddXY(RJX[0], RJX[1]);
}
public void ClearIntersection()
{
chart1.Series[7].Points.Clear();
}
public void ShowTrajectory(double R, double X)
{
RJX = Intersection(R, X);
chart1.Series[17].Points.AddXY(RJX[0], RJX[1]);
}
public void ClearTrajectory()
{
chart1.Series[17].Points.Clear();
}
public void Initilizelabel(Label label1,Label label2,Label label3,Label label4,Label label5,Label label6,Label label7,Label label8,Label label9,Label label10,Label label11,Label label12 ,Label label13)
{
label1.Parent = chart1;
label1.Text = "50";
label1.BackColor = Color.Transparent;
label1.Location = new Point(chart1.Size.Width/2 ,chart1.Size.Height/2 );
label2.Parent = chart1;
label2.Text = "10";
label2.BackColor = Color.Transparent;
label2.Location = new Point(chart1.Size.Width / 5 - label1.Size.Width/2, chart1.Size.Height / 2);
label3.Parent = chart1;
label3.Text = "25";
label3.BackColor = Color.Transparent;
label3.Location = new Point(chart1.Size.Width / 3 + label3.Size.Width/5 , chart1.Size.Height / 2);
label4.Parent = chart1;
label4.Text = "100";
label4.BackColor = Color.Transparent;
label4.Location = new Point(chart1.Size.Width/2 +chart1.Size.Width/9+chart1.Size.Width/25 , chart1.Size.Height / 2);
label5.Parent = chart1;
label5.Text = "50";
label5.BackColor = Color.Transparent;
label5.Location = new Point(chart1.Size.Width / 2 - label1.Size.Width / 2, 0);
label6.Parent = chart1;
label6.Text = "10";
label6.BackColor = Color.Transparent;
label6.Location = new Point(chart1.Size.Width /25 , chart1.Size.Height/4+chart1.Size.Height/20);
label7.Parent = chart1;
label7.Text = "-10";
label7.BackColor = Color.Transparent;
label7.Location = new Point( chart1.Size.Width / 25, chart1.Size.Height - (chart1.Size.Height / 4 + chart1.Size.Height / 15));
label8.Parent = chart1;
label8.Text = "25";
label8.BackColor = Color.Transparent;
label8.Location = new Point(chart1.Size.Width / 5,chart1.Size.Height/10 );
label9.Parent = chart1;
label9.Text = "-25";
label9.BackColor = Color.Transparent;
label9.Location = new Point(chart1.Size.Width / 5-label9.Size.Width/2, chart1.Size.Height- chart1.Size.Height / 10 - label9.Size.Height);
label10.Parent = chart1;
label10.Text = "-50";
label10.BackColor = Color.Transparent;
label10.Location = new Point(chart1.Size.Width / 2 - label1.Size.Width / 2, chart1.Size.Height-label10.Size.Height);
label11.Parent = chart1;
label11.Text = "100";
label11.BackColor = Color.Transparent;
label11.Location = new Point(chart1.Size.Width- chart1.Size.Width /4+label11.Size.Width/8, chart1.Size.Height / 10);
label12.Parent = chart1;
label12.Text = "-100";
label12.BackColor = Color.Transparent;
label12.Location = new Point(chart1.Size.Width - chart1.Size.Width / 4 + label11.Size.Width / 8,chart1.Size.Height- chart1.Size.Height / 10 -label12.Size.Height);
label13.Parent = chart1;
label13.Text = " 0";
label13.BackColor = Color.Transparent;
label13.Location = new Point(-5,chart1.Size.Height/2);
}
public void initialize()
{
double[] theta = Linespace(-Math.PI, Math.PI, 100);
double[] theta1 = Linespace(-Math.PI, (-Math.PI / 2), 100);
double[] theta2 = Linespace((Math.PI / 2), Math.PI, 100);
chart1.Legends[0].Enabled = false;
chart1.ChartAreas[0].AxisX.Minimum = -1.001;
chart1.ChartAreas[0].AxisX.Maximum = 1.001;
chart1.ChartAreas[0].AxisY.Minimum = -1.001;
chart1.ChartAreas[0].AxisY.Maximum = 1.001;
//chart1.Series.Clear();
chart1.ChartAreas[0].AxisX.MajorGrid.Enabled = false;
chart1.ChartAreas[0].AxisY.MajorGrid.Enabled = false;
chart1.ChartAreas[0].AxisX.Enabled = AxisEnabled.False;
chart1.ChartAreas[0].AxisY.Enabled = AxisEnabled.False;
chart1.Series[0].ChartType = SeriesChartType.Spline;
chart1.Series[0].Color = Color.Black;
for (int i = 0; i < theta.Length; i++) //大圆
{
chart1.Series[0].Points.AddXY(Convert.ToDouble(Math.Cos(theta[i])), Math.Sin(theta[i]));
}
chart1.Series.Add("circular"); // 小圆
chart1.Series[1].ChartType = SeriesChartType.Spline;
chart1.Series[1].Color = System.Drawing.Color.Black;
for (int j = 0; j < theta.Length; j++)
{
chart1.Series[1].Points.AddXY(0.5 * (Math.Cos(theta[j])) + 0.5, 0.5 * Math.Sin(theta[j]));
}
chart1.Series.Add("AXISX"); //X轴
chart1.Series[2].ChartType = SeriesChartType.Spline;
chart1.Series[2].Color = Color.Black;
chart1.Series[2].Points.AddXY(-1, 0);
chart1.Series[2].Points.AddXY(1, 0);
chart1.Series.Add("j+"); // 电抗+
chart1.Series[3].ChartType = SeriesChartType.Spline;
chart1.Series[3].Color = Color.Black;
for (int i = 0; i < theta1.Length; i++)
{
chart1.Series[3].Points.AddXY(Math.Cos(theta[i]) + 1, Math.Sin(theta[i]) + 1);
}
chart1.Series.Add("j-"); // 电容-
chart1.Series[4].ChartType = SeriesChartType.Spline;
chart1.Series[4].Color = Color.Black;
for (int i = 0; i < theta1.Length; i++)
{
chart1.Series[4].Points.AddXY(Math.Cos(theta[i]) + 1, Math.Sin(theta[i]) - 1);
}
chart1.Series.Add("SmithR");
chart1.Series[5].ChartType = SeriesChartType.Spline;
chart1.Series.Add("SmithX");
chart1.Series[6].ChartType = SeriesChartType.Spline;
chart1.Series.Add("R+JX");
chart1.Series[7].ChartType = SeriesChartType.Point;
chart1.Series[7].MarkerStyle = MarkerStyle.Circle;
chart1.Series[7].MarkerSize = 4;
// 初始化电阻圆
chart1.Series.Add("R10");
chart1.Series[8].ChartType = SeriesChartType.Spline;
chart1.Series[8].Color = Color.Black;
SmithShowR(10, 8);
chart1.Series.Add("R25");
chart1.Series[9].ChartType = SeriesChartType.Spline;
chart1.Series[9].Color = Color.Black;
SmithShowR(25, 9);
chart1.Series.Add("R100");
chart1.Series[10].ChartType = SeriesChartType.Spline;
chart1.Series[10].Color = Color.Black;
SmithShowR(100, 10);
//初始化电抗圆+
chart1.Series.Add("X10");
chart1.Series[11].ChartType = SeriesChartType.Spline;
chart1.Series[11].Color = Color.Black;
double[] thetaX10 = Linespace((-Math.PI) * 0.6255, -Math.PI / 2, 100);
for (int i = 0; i < thetaX10.Length; i++)
{
chart1.Series[11].Points.AddXY(Math.Cos(thetaX10[i]) / 0.2 + 1, Math.Sin(thetaX10[i]) / 0.2 + 1 / 0.2);
}
chart1.Series.Add("X25");
chart1.Series[12].ChartType = SeriesChartType.Spline;
chart1.Series[12].Color = Color.Black;
double[] thetaX25 = Linespace((-Math.PI) * 0.795, -Math.PI / 2, 100);
for (int i = 0; i < thetaX25.Length; i++)
{
chart1.Series[12].Points.AddXY(Math.Cos(thetaX25[i]) / 0.5 + 1, Math.Sin(thetaX25[i]) / 0.5 + 1 / 0.5);
}
chart1.Series.Add("X100");
chart1.Series[13].ChartType = SeriesChartType.Spline;
chart1.Series[13].Color = Color.Black;
double[] thetaX100 = Linespace((-Math.PI) * 1.205, -Math.PI / 2, 100);
for (int i = 0; i < thetaX100.Length; i++)
{
chart1.Series[13].Points.AddXY(Math.Cos(thetaX100[i]) / 2 + 1, (Math.Sin(thetaX100[i]) / 2 + (1 / 2.0)));
}
//初始化电抗圆-
chart1.Series.Add("-X10");
chart1.Series[14].ChartType = SeriesChartType.Spline;
chart1.Series[14].Color = Color.Black;
double[] negative10 = Linespace((Math.PI) * 1.5, Math.PI * 2 * 0.8129, 100);
for (int i = 0; i < negative10.Length; i++)
{
chart1.Series[14].Points.AddXY(Math.Cos(negative10[i]) / -0.2 + 1, Math.Sin(negative10[i]) / -0.2 + 1 / -0.2);
}
chart1.Series.Add("-X25");
chart1.Series[15].ChartType = SeriesChartType.Spline;
chart1.Series[15].Color = Color.Black;
double[] negative25 = Linespace((Math.PI) * 1.5, Math.PI * 2 * 0.8975, 100);
for (int i = 0; i < negative10.Length; i++)
{
chart1.Series[15].Points.AddXY(Math.Cos(negative25[i]) / -0.5 + 1, Math.Sin(negative25[i]) / -0.5 + 1 / -0.5);
}
chart1.Series.Add("-X100");
chart1.Series[16].ChartType = SeriesChartType.Spline;
chart1.Series[16].Color = Color.Black;
double[] negative100 = Linespace(-Math.PI, Math.PI * 0.5 * 0.41, 100);
for (int i = 0; i < negative100.Length; i++)
{
chart1.Series[16].Points.AddXY(Math.Cos(negative100[i]) / -2.0 + 1, Math.Sin(negative100[i]) / -2.0 + 1 / -2.0);
}
chart1.Series.Add("Trajectory"); // 画轨迹
chart1.Series[17].ChartType = SeriesChartType.Spline;
chart1.Series[17].Color = Color.Green;
chart1.Series[17].MarkerStyle = MarkerStyle.Cross;
chart1.Series[17].MarkerSize = 4;
//chart1.Series[1].Points.AddXY(0.5, 0);
//chart1.Series[1].Points.AddXY(0.5, 1);
//Console.WriteLine(Math.Cos(Math.PI));
//chart1.Series[0].Points.AddXY(-1, 0);
//chart1.Series[0].Points.AddXY(0, 1);
//chart1.Series[0].Points.AddXY(1, 0);
//chart1.Series[0].Points.AddY(0);
}
}
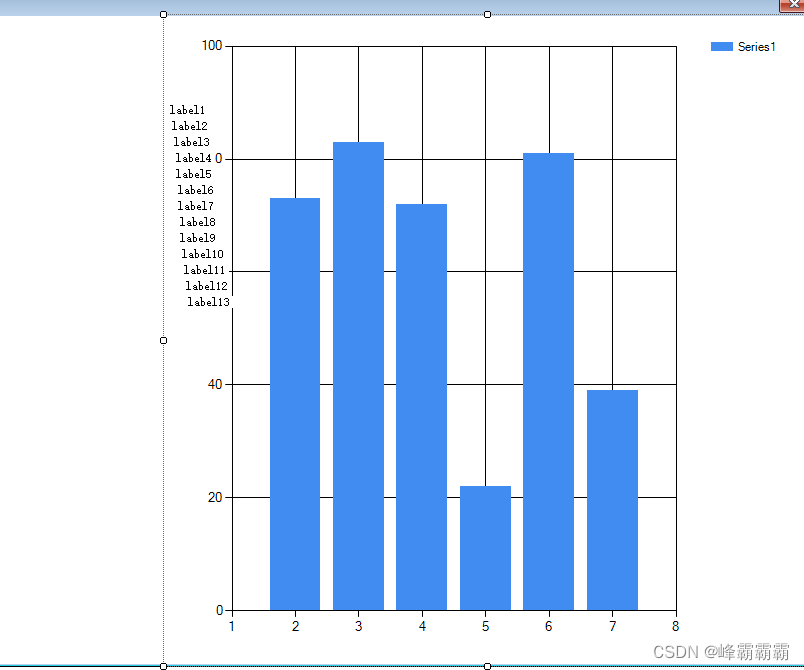
然后在主界面中 添加一个chart 控件 和 13 个 label
先定义一个对象 smith
初始化 斯密斯原图
smith.Chart = chart1;
smith.initialize();
smith.Initilizelabel(label1, label2, label3, label4, label5, label6, label7, label8, label9, label10, label11, label12, label13);
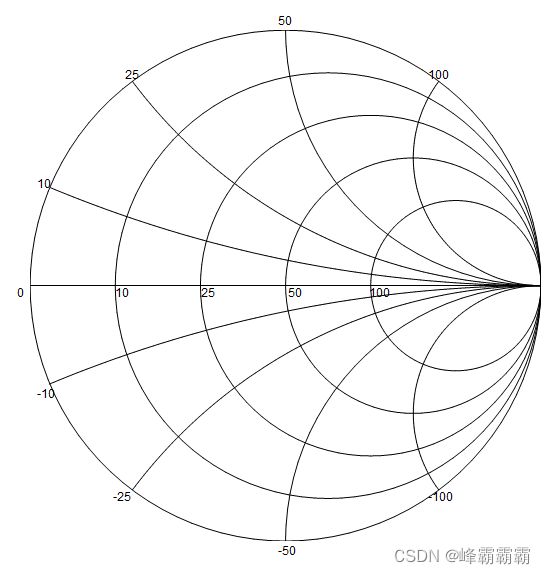
就会得到 下面这个图
要显示阻抗点 就调用
smith.ShowIntersection(Smith_Points_R, Smith_Points_X);
方法里面自动 /50 了 ,R 和X 不要/50;
具体如何画出来的?
简单的来说 就是先生成电阻圆,在生成 电感(电抗)圆,两个圆的交点就是smith圆图的显示阻抗点。
一开始想用联立方程 向量等求解坐标 后来发现要还要调用其他的类,索性直接初中平面几何求解交点。
求解两个圆的交点最后我参考的是:求解两圆相交的交点坐标_求两圆的交点坐标_走过_冬天的博客-CSDN博客

