Pyhton寻找曲线上的波峰
import open3d as o3d
import numpy as np
import matplotlib.pyplot as plt
from scipy.signal import find_peaks
import copy
import os
import sys
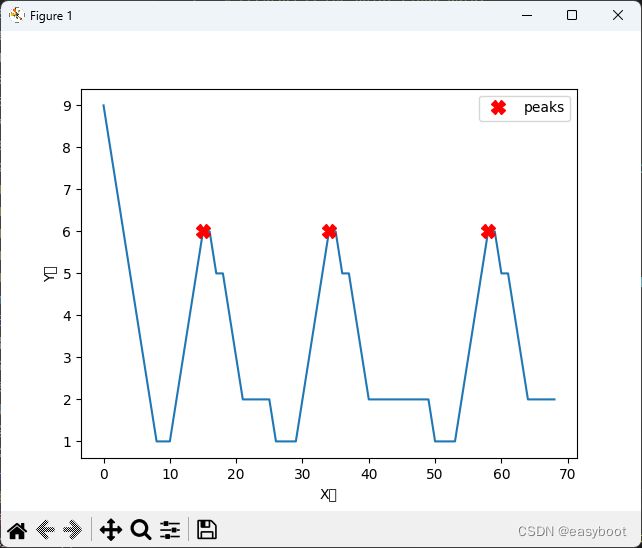
x=np.array([9,8,7,6,5,4,3,2,1,1,1,2,3,4,5,6,6,5,5,4,3,2,2,2,2,2,1,1,1,1,2,3,4,5,6,6,5,5,4,3,2,2,2,2,2,2,2,2,2,2,1,1,1,1,2,3,4,5,6,6,5,5,4,3,2,2,2,2,2])
peaks,_=find_peaks(x)
plt.plot(x)
plt.xlabel('X轴')
plt.ylabel('Y轴')
plt.plot(peaks,x[peaks],'X',color='r',markersize=10,label='peaks')
plt.legend()
plt.show()