statistics
Cox proportional hazard models [2]
Related Concepts / Basics:
A regression model. f(one or more predictor variables) = suivival time of patients. Compared with Kaplan-Meier curves and log-rank tests, which are both examples of univariate analysis and useful only for categorical independent variables, Cox proportional hazards regression can not only handle categorical variables but also can relatively work easily for quantitative predictors and for several risk factors simultaneously.
hazard rate == the rate of a particular event happening(e.g.,infection, death) at a particular point in time. CoxPHM examines how specified factors influence the hazard rate.
cox model: a hazard function interpreted as the risk of dying at time t. estimated as follow [2]:

t: survival time; h(t): a hazard function determined by a set of p covariates(xp), varying over time; coefficients(bp); h0: the baseline hazard, corresponding to the value of the hazard if all xp are equal to zero(exp(0) = 1).
hazard ratios(HR) = exp(bi). where bi > 0 or HR > 1, the value of ith covariate ↑,event hazard ↑,length of survival ↓. ( HR > 1→ the covariate is positively associated with the event probability, and thus negatively associated with the length of survival.) (HR == 1, no effect)
coef & hr: e.g.,coef >0, hr = exp(coef) >1, effect size of covariate, interpreted as: ‘the corresponding covariate have higher risk of death’
Cox Model Assumption(!!!should be tested: assessing proportionality): a key assumption of Cox model: hazard curves for the groups of observations should be proportional and cannot across, and thus

so the model is called ' proportional-hazards model'. it implies the hazard of event in any group is a constant multiple of hazard in any other.
Implementation procedure with R code: ( package survival for computing survival analysis & surminer for visualization): coxph(formula, data, method),formula is like 'Surv(time, event) ~ covariates', data is a data frame, method is 'efron' by default, other options are 'breslow' and 'exact'. breslow is once-popular. the default efron is generally preferred. the exact is computationally intensive.
Odds Ratio [5]
relationship: a variable & a binary outcome:

'the odds of an event occurring is a ratio itself. therefore, an OR is a ratio of two ratios.'

risk factor: event refers to the ocurring of a disease. OR > 1
protective factor: OR < 1
OR == 1: no association between condition and disease occurrence.
Correlation coefficient r[6]
a descriptive statistic. a number in [-1, 1], telling the strength and direction of a relationship between variables, reflecting how similar the measurements are across a dataset.
r > 0 → when one variable changes, the other changes in the same direction.
!!! test statistic: if r is based on sample data, do a F test or t test that tells you the statistical significance of your finding.
to get high statistical power and accuracy, select the most appropriate type of r for your data.
types:
the following table is from the reference [6] page.

Pearson's r : the most commonly used one, allowing for strong inference. ① parametric ② measuring linear relationships.
assumptions:
1 both variables are on an interval or ratio level of measurement;2 both variables follow normal distributions;3 no outliers;4 from a random or representive sample;5 expext a linear relationship.
But if data do not meet all assumptions for this test, consider a non-parametric test instead.
Spearman's rho : Spearman's rank correlation coefficient. while the Pearson's measures the linearity of relationship, the Spearman's measures the monotonicity of relationships.the former expects a relationship where each variable changes in one direction at the same rate throughout the data range, the latter one direction but not necessarily at the same rate.
Correlation of determination[6]
r^2, [0, 1].used in regression models to measure how much of the variance of one variable is explained by the variance of the other variable.
'r may often overestimate the relationship, especially in small samples. r2 is often a better indicator.'
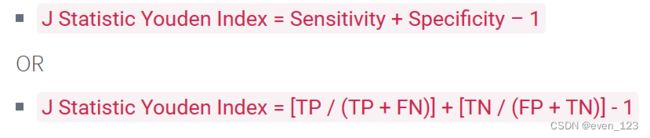
Youden index[14]
represents a summary measurement of the receiver operating characteristic curve for the accuracy of a diagnostic test with oridinal or continuous endpoints. it gives equal weight to FP &FNvalues, so it can be concluded that when two tests have the same index, they have the same proportion of total misclassified results.
Bonferroni correction [13]
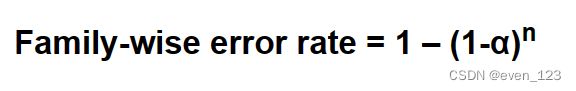
FWER: probability that at least one of the tests produces a false positive.
a bonferroni correction refers to the process of adjusting the alpha level for a family of statistical tests sothat we control for the probability of committing a type Ⅰ error.

Decision curve analysis
[12]:
to define a exchange rate: the harm of delaying diagnosis of a disease is how much times greater greater than that of an unnecessary test. in 10 men undergoing biopsy, one cancer found equates to nine unnecessary biopsies for each cancer detected. then the rate is 1/9,net benefit = benefit -(harm*exchange rate)
to define a threshold probability: 'if a clinician would be willing to conduct as many as 20biopsies to find a high grade cancer, the probability threshold would be 5%'

DCA calculates the net benefit of one or more prediction models. [11]
net benefit = sensitivity * prevalence - (1-specificity)*(1-prevalence)*w
w: odds, p/(1-p)
![]()
threshold probability: minimum probability for further interventiong of a disease.
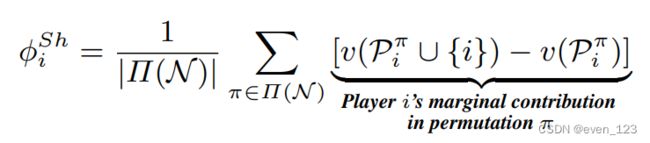
SHapley Additive exPlanations (SHAP) [3]
SHAP, computing the contribution of each feature to the prediction. Shapley value explanation is represented as an additive feature attribution method, a linear model. that view connects LIME and Shapley values. it is used to explain the output of machine learning models[9] (does it include DL here? in definite DL applications which method is used to explain the model's output?) it can be used with any ML model.
SHAP is computed from coslitional game theory. A player can be an individual feature value or a group of feature values.
calculation[10]:
Gradient-weighted class activation mapping (Grad-CAM)
'visual explanations' for CNN based models. 'flowing into the final convolutional layer to produce a coarse localization map highlighting important regions in the image for predicting the concept'. [4]
to compute the gradient of the score for a specific class to obtain neuron importance weights → to apply a ReLU to the linear combination of maps for positive influence.
!!!??? [8]:
[0.5, 1.0]: no discriminating ability or perfect ability to discriminate between cases with different outcomes.
the t-year area under the receiver operating characteristic(ROC) curve(AUCt) is an alternative measure of the discriminative ability. [ related articles: 1.PENCINA, M. J., D’AGOSTINO, R. B., LARSON, M. G., MASSARO, J. M. AND VASAN, R. S. (2009). Predicting the 30-year risk of cardiovascular disease. Circulation 119, 3078–3084. 2. CHAMBLESS, L. E. AND DIAO, G. (2006). Estimation of time-dependent area under the ROC curve for long-term risk prediction. Statistics in Medicine 25, 3474–3486.]

the authers argue that c-index may be valuable when evaluate a correlation between the continuous event time and a prediction (the order of ) the event times, but for situations in which the aim is to predict the risk of an event for a given time horizon('t-year predicted probabilities'), c-index is not a proper scoring rule.
Concordance statistic(also known as C-statistic)[7]
to measure the predictive accuracy of a statistical model by the agreement between observed and predicted outcomes. C-index ,in the context of logistic regression with binary outcomes, is most commonly used. the underlying concept is that a subject who experiences a particular outcome has a higher predicted probability of that outcome than a subject who does not experience the outcome.
calculated as the proportion of pairs of subjects whose observed and predicted outcomes agree or in other words are concordant among all possible pairs. higher C-index means better discriminating ability between subjects who do experience the outcome of interest and subjects who do not.
paired C-index & R package CompareC (v1.3.2)
Re
CoxPHFitter & lifelines package (v0.27.4) under Python with a penalizer of 0.01 to facilitate model convergence [1]
Re
References:
[1] Plasma proteomic profiles predict individual future health risk | Nature Communications
[2] Cox Proportional-Hazards Model - Easy Guides - Wiki - STHDA
[3] 9.6 SHAP (SHapley Additive exPlanations) | Interpretable Machine Learning (christophm.github.io)
[4] [1610.02391] Grad-CAM: Visual Explanations from Deep Networks via Gradient-based Localization (arxiv.org)
[5] Odds Ratio: Formula, Calculating & Interpreting - Statistics By Jim
[6] Correlation Coefficient | Types, Formulas & Examples (scribbr.com)
[7] SAS Help Center: Concordance Statistics
[8] Blanche P, Kattan MW, Gerds TA. The c-index is not proper for the evaluation of $t$-year predicted risks. Biostatistics. 2019;20(2):347-357. doi:10.1093/biostatistics/kxy006
[9] SHapley Additive exPlanations ou SHAP : What is it ? (datascientest.com)
[10]
| https://doi.org/10.48550/arXiv.2202.0559 |
[11] 临床模型的决策曲线分析解读 - Zhongxu blog (zxzyl.com)
[12] doi: 10.1136/bmj.i6 | BMJ 2016;352:i6 | the bmj
[13] The Bonferroni Correction: Definition & Example (statology.org)
[14] Youden Index Calculator (mdapp.co)