Flume用法总结
Flume用法总结
一、Flume是什么
Flume是Cloudera提供的一个高可用的,高可靠的,分布式的海量日志采集、聚合和传输的系统。可以实时读取服务器的日志写入HDFS。
在Hadoop生态系统中,规模最大,知名度最高的公司就是Cloudera,2008年成立的Cloudera是最早将Hadoop商用的公司,为合作伙伴提供Hadoop商用解决方案。Cloudera企业解决方案包括Cloudera Hadoop发行版(Cloudera’s Distribution Including Apache Hadoop,简称CDH),Cloudera Manager(CM)等。概括起来说,Cloudera提供一个可伸缩,稳定的,综合的企业级大数据管理平台,它拥有最多的部署案例,提供强大的部署,管理和监控工具。 (取自CDH官网简介)
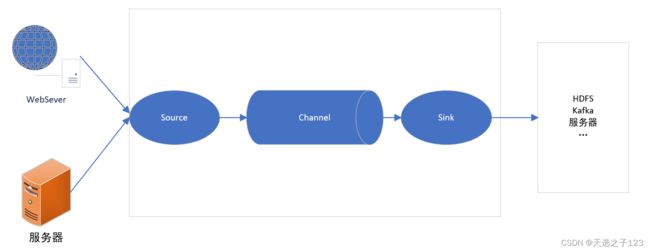
1、Source
负责接收数据的组件,可以处理各种类型的日志数据,包括avro、thrift、exec、jms、spooling directory、netcat、sequence generator、syslog、http、legacy
| 可接收类型 | 说明 |
|---|---|
| avro | Avro 客户端发送的数据(Avro是一个数据序列化系统,设计用于支持大批量数据交换的应用) |
| thrift | Thrift 客户端发送的数据 |
| exec | 执行指定的shell,并从该命令标准输出中获取数据(指令出错或者flume的agent不允许时将无法收集数据) |
| spooling directory | 监听一个文件夹下新产生的文件,并读取内容,发至 channel。使用该 Source 需要注意两点:第一个是拷贝到 spool 目录下的文件不可以再打开编辑,第二个是 spool 目录下不可包含相应的子目录。这个主要用途作为对日志的准实时监控。该Source可靠性和稳定性较好。 |
| netcat | 一个NetCat Source用来监听一个指定端口,并接收监听到的数据 |
| kafka | 内置了Kafka Consumer,可从 KaFka Broker 中读取某个 topic的数据。 |
| taildir | 可以实时监控一个目录下文件的变化,并实时读取新增数据,记录断点,保证重启 Agent 后数据不丢失或被重复传输。 |
| syslog | Syslog 分为 Tcp Source和 UDP Source两种,分别接受tcp和udp协议发过来的数据。 |
| http | HTTP协议发来的数据 |
| sequence generator | 一个简单的序列发生器,不断的产生事件,值是从0开始每次递增1。主要用来测试。 |
2、Channel
Channel是位于Source和Sink之间的缓冲区。因此,Channel允许Source和Sink运作在不同的速率上。Channel是线程安全的,可以同时处理几个Source的写入操作和几个Sink的读取操作。
Flume自带两种Channel:Memory Channel和File Channel。
-
Memory Channel:内存中的队列。Memory Channel在不需要关心数据丢失的情景下适用。如果需要关心数据丢失,那么Memory Channel就不应该使用,因为程序死亡、机器宕机或者重启都会导致数据丢失。
-
File Channel:将所有事件写到磁盘。因此在程序关闭或机器宕机的情况下不会丢失数据。
3、Sink
轮询Channel中的事件且批量地移除它们,并将这些事件批量写入到存储或索引系统、或者被发送到另一个Flume Agent。
Sink组件可以写入的位置包括hdfs、logger、avro、thrift、ipc、file、HBase、solr等。
4、Event
lume数据传输的基本单元,以Event的形式将数据从源头送至目的地。
Event由Header和Body两部分组成
-
Header:用来存放该event的一些属性,为K-V结构。
-
Body:以字节数字的形式存放该条数据。
二、采集样例
1、服务器端口监控(netcat数据源)
-
安装netcat
一般服务器会自带该工具,如果有可以不进行安装,多次安装倒也没啥事。因为我安装服务器的时候选择最小安装,所以还是安装了一下。
sudo yum install -y nc -
判断端口是否可用
sudo netstat -tunlp | grep 66666 -
创建Flume Agent配置文件flume-netcat-logger.conf
在flume的安装目录下创建文件夹
mkdir job在文件夹下创建Flume Agent的配置文件
vim flume-netcat-logger.conf# Name the components on this agent a1.sources = r1 a1.sinks = k1 a1.channels = c1 # Describe/configure the source a1.sources.r1.type = netcat a1.sources.r1.bind = localhost a1.sources.r1.port = 66666 # Describe the sink a1.sinks.k1.type = logger # Use a channel which buffers events in memory a1.channels.c1.type = memory a1.channels.c1.capacity = 1000 a1.channels.c1.transactionCapacity = 100 # Bind the source and sink to the channel a1.sources.r1.channels = c1 a1.sinks.k1.channel = c1 -
开启Flume监听端口
命令1
bin/flume-ng agent --conf conf/ --name a1 --conf-file job/flume-netcat-logger.conf -Dflume.root.logger=INFO,console命令2
bin/flume-ng agent -c conf/ -n a1 -f job/flume-netcat-logger.conf -Dflume.root.logger=INFO,console参数 值 说明 –conf 或者 -c conf/ flume的配置文件存储位置 –name 或者 -n a1 agent名称 –conf-file 或者 -f job/flume-netcat-logger.conf flume本次启动读取的配置文件 -Dflume.root.logger=INFO,console -D表示flume运行时动态修flume.root.logger参数属性值,并将控制台日志打印级别设置为INFO级别。日志级别包括:log、info、warn、error。 -
使用netcat向端口发送日志
nc localhost 66666
![]()
2、执行日志监控写入HDFS(exec数据源)
监控hive日志并写入hdfs
创建配置文件
flume_exec_hdfs.conf
# Name the components on this agent
a2.sources = r2
a2.sinks = k2
a2.channels = c2

# Describe/configure the source
a2.sources.r2.type = exec
a2.sources.r2.command = tail -F /opt/module/hive/logs/hive.log
a2.sources.r2.shell = /bin/bash -c

# Describe the sink
a2.sinks.k2.type = hdfs
a2.sinks.k2.hdfs.path = hdfs://hadoop102:8020/flume/%Y%m%d/%H
#上传文件的前缀
a2.sinks.k2.hdfs.filePrefix = logs-
#是否按照时间滚动文件夹
a2.sinks.k2.hdfs.round = true
#多少时间单位创建一个新的文件夹
a2.sinks.k2.hdfs.roundValue = 1
#重新定义时间单位
a2.sinks.k2.hdfs.roundUnit = hour
#是否使用本地时间戳
a2.sinks.k2.hdfs.useLocalTimeStamp = true
#积攒多少个Event才flush到HDFS一次
a2.sinks.k2.hdfs.batchSize = 100
#设置文件类型,可支持压缩
a2.sinks.k2.hdfs.fileType = DataStream
#多久生成一个新的文件
a2.sinks.k2.hdfs.rollInterval = 60
#设置每个文件的滚动大小
a2.sinks.k2.hdfs.rollSize = 134217700
#文件的滚动与Event数量无关
a2.sinks.k2.hdfs.rollCount = 0

# Use a channel which buffers events in memory
a2.channels.c2.type = memory
a2.channels.c2.capacity = 1000
a2.channels.c2.transactionCapacity = 100

# Bind the source and sink to the channel
a2.sources.r2.channels = c2
a2.sinks.k2.channel = c2
运行flume
bin/flume-ng agent --conf conf/ --name a2 --conf-file job/flume_exec_hdfs.conf
开启hive即可在hdfs对应目录下看到文件
3、整个目录下的文件监控(spooling directory数据源)
创建文件配置文件 flume-dir-hdfs.conf
a3.sources = r3
a3.sinks = k3
a3.channels = c3

# Describe/configure the source
a3.sources.r3.type = spooldir
a3.sources.r3.spoolDir = /opt/module/flume/upload
a3.sources.r3.fileSuffix = .COMPLETED
a3.sources.r3.fileHeader = true
#忽略所有以.tmp结尾的文件,不上传
a3.sources.r3.ignorePattern = ([^ ]*\.tmp)

# Describe the sink
a3.sinks.k3.type = hdfs
a3.sinks.k3.hdfs.path = hdfs://hadoop102:8020/flume/upload/%Y%m%d/%H
#上传文件的前缀
a3.sinks.k3.hdfs.filePrefix = upload-
#是否按照时间滚动文件夹
a3.sinks.k3.hdfs.round = true
#多少时间单位创建一个新的文件夹
a3.sinks.k3.hdfs.roundValue = 1
#重新定义时间单位
a3.sinks.k3.hdfs.roundUnit = hour
#是否使用本地时间戳
a3.sinks.k3.hdfs.useLocalTimeStamp = true
#积攒多少个Event才flush到HDFS一次
a3.sinks.k3.hdfs.batchSize = 100
#设置文件类型,可支持压缩
a3.sinks.k3.hdfs.fileType = DataStream
#多久生成一个新的文件
a3.sinks.k3.hdfs.rollInterval = 60
#设置每个文件的滚动大小大概是128M
a3.sinks.k3.hdfs.rollSize = 134217700
#文件的滚动与Event数量无关
a3.sinks.k3.hdfs.rollCount = 0

# Use a channel which buffers events in memory
a3.channels.c3.type = memory
a3.channels.c3.capacity = 1000
a3.channels.c3.transactionCapacity = 100

# Bind the source and sink to the channel
a3.sources.r3.channels = c3
a3.sinks.k3.channel = c3
启动监控
bin/flume-ng agent --conf conf/ --name a3 --conf-file job/flume-dir-hdfs.conf
在使用Spooling Directory Source时,不要在监控目录中创建并持续修改文件;上传完成的文件会以.COMPLETED结尾;被监控文件夹每500毫秒扫描一次文件变动。
4、 多个实时追加的文件监控(taildir数据源)
创建配置文件 flume-taildir-hdfs.conf
a3.sources = r3
a3.sinks = k3
a3.channels = c3

# Describe/configure the source
a3.sources.r3.type = TAILDIR
a3.sources.r3.positionFile = /opt/module/flume/tail_dir.json
a3.sources.r3.filegroups = f1 f2
a3.sources.r3.filegroups.f1 = /opt/module/flume/files/.*file.*
a3.sources.r3.filegroups.f2 = /opt/module/flume/files/.*log.*

# Describe the sink
a3.sinks.k3.type = hdfs
a3.sinks.k3.hdfs.path = hdfs://hadoop102:8020/flume/upload2/%Y%m%d/%H
#上传文件的前缀
a3.sinks.k3.hdfs.filePrefix = upload-
#是否按照时间滚动文件夹
a3.sinks.k3.hdfs.round = true
#多少时间单位创建一个新的文件夹
a3.sinks.k3.hdfs.roundValue = 1
#重新定义时间单位
a3.sinks.k3.hdfs.roundUnit = hour
#是否使用本地时间戳
a3.sinks.k3.hdfs.useLocalTimeStamp = true
#积攒多少个Event才flush到HDFS一次
a3.sinks.k3.hdfs.batchSize = 100
#设置文件类型,可支持压缩
a3.sinks.k3.hdfs.fileType = DataStream
#多久生成一个新的文件
a3.sinks.k3.hdfs.rollInterval = 60
#设置每个文件的滚动大小大概是128M
a3.sinks.k3.hdfs.rollSize = 134217700
#文件的滚动与Event数量无关
a3.sinks.k3.hdfs.rollCount = 0

# Use a channel which buffers events in memory
a3.channels.c3.type = memory
a3.channels.c3.capacity = 1000
a3.channels.c3.transactionCapacity = 100

# Bind the source and sink to the channel
a3.sources.r3.channels = c3
a3.sinks.k3.channel = c3
启动
bin/flume-ng agent --conf conf/ --name a3 --conf-file job/flume-taildir-hdfs.conf
Taildir Source维护了一个json格式的position File,其会定期的往position File中更新每个文件读取到的最新的位置,因此能够实现断点续传。
找了半天也就找了这么几个案例,其余的用到了再说吧
三、Ganglia
1、Ganglia是什么
Ganglia是UC Berkeley发起的一个开源集群监视项目,设计用于测量数以千计的节点。Ganglia的核心包含gmond、gmetad以及一个Web前端。主要是用来监控系统性能,如:cpu 、mem、硬盘利用率,I/O负载、网络流量情况等,通过曲线很容易见到每个节点的工作状态,对合理调整、分配系统资源,提高系统整体性能起到重要作用。
2、组成
Ganglia由gmond、gmetad和gweb四部分组成。
-
gmond(Ganglia Monitoring Daemon)用于节点信息的收集和存储
是一种轻量级服务,安装在每台需要收集指标数据的节点主机上。
使用gmond,你可以很容易收集很多系统指标数据,如CPU、内存、磁盘、网络和活跃进程的数据等。
-
gmetad(Ganglia Meta Daemon)用于轮询gmond节点存储的信息
Gmetad可以配置轮询的gmond节点,通过source 参数配置。
这里的个gmond节点就是udp_send_channel所配置的节点,可以是hostname或者ip
整合所有信息,并将其以RRD格式存储至磁盘的服务。
-
gweb(Ganglia Web)可视化工具
gweb是一种利用浏览器显示gmetad所存储数据的PHP前端。在Web界面中以图表方式展现集群的运行状态下收集的多种不同指标数据。
3、安装部署
-
安装httpd、php
sudo yum -y install httpd php -
安装其他依赖
sudo yum -y install rrdtool perl-rrdtool rrdtool-devel apr-devel epel-release -
安装Ganglia
sudo yum -y install ganglia-gmond ganglia-gmetad ganglia-web -
修改配置文件
(1)修改 ganglia.conf
sudo vim /etc/httpd/conf.d/ganglia.conf# Ganglia monitoring system php web frontend Alias /ganglia /usr/share/ganglia# Order deny,allow # Deny from all # Allow from all # Allow from 127.0.0.1 # Allow from ::1 # Allow from .example.com Require all granted Location> (2)修改 gmetad.conf
sudo vim /etc/ganglia/gmetad.confdata_source "主机hostname" ip(3)修改 gmond.conf
sudo vim /etc/ganglia/gmond.confcluster { name = "主机hostname" owner = "unspecified" latlong = "unspecified" url = "unspecified" } udp_send_channel { #bind_hostname = yes # Highly recommended, soon to be default. # This option tells gmond to use a source address # that resolves to the machine's hostname. Without # this, the metrics may appear to come from any # interface and the DNS names associated with # those IPs will be used to create the RRDs. # mcast_join = 239.2.11.71 host = ip port = 8649 ttl = 1 } udp_recv_channel { # mcast_join = 239.2.11.71 port = 8649 bind = ip retry_bind = true # Size of the UDP buffer. If you are handling lots of metrics you really # should bump it up to e.g. 10MB or even higher. # buffer = 10485760 }(4)修改 /etc/selinux/config
sudo vim /etc/selinux/configSELINUX=disabledsudo setenforce 0 -
赋权
sudo chmod -R 777 /var/lib/ganglia -
启动ganglia
sudo service httpd start sudo service gmetad start sudo service gmond start -
查看
http://ip/ganglia
4、监控flume运行情况
-
修改配置
cp /opt/module/flume/conf/flume-env.sh.template /opt/module/flume/conf/flume-env.sh修改文件
vim /opt/module/flume/conf/flume-env.shJAVA_OPTS="-Dflume.monitoring.type=ganglia -Dflume.monitoring.hosts=192.168.1.102:8649 -Xms100m -Xmx200m" -
启动Flume任务
结合本文 第二章节 1、netcat数据源
bin/flume-ng agent \ --conf conf/ \ --name a1 \ --conf-file job/flume-netcat-logger.conf \ -Dflume.root.logger==INFO,console \ -Dflume.monitoring.type=ganglia \ -Dflume.monitoring.hosts=ip:8649 -
查看仪表盘如下
http://ip/ganglia
图表 含义 EventPutAttemptCount source尝试写入channel的事件总数量 EventPutSuccessCount 成功写入channel且提交的事件总数量 EventTakeAttemptCount sink尝试从channel拉取事件的总数量 EventTakeSuccessCount sink成功读取的事件的总数量 StartTime channel启动的时间(毫秒) StopTime channel停止的时间(毫秒) ChannelSize 目前channel中事件的总数量 ChannelFillPercentage channel占用百分比 ChannelCapacity channel的容量 可能看起来不太美观,但是它免费。可能还有其他更好的软件可以做,待后续补充。