jmh学习笔记-源代码编译与bench mode
系列文章目录
jmh学习笔记-源代码编译与bench mode
jmh学习笔记-State共享对象
jmh学习笔记-State共享对象前后置方法
jmh学习笔记-代码清除
jmh学习笔记-常量折叠
jmh学习笔记-Forking分叉
jmh学习笔记-环境配置
jmh学习笔记-缓存行的处理方式
jmh学习笔记-自定义项目引入jmh
文章目录
- 系列文章目录
- 前言
- 一、jmh源码编译
- 二、jmh测试案例分析
-
- 1、平均测试时间
- 2、采样执行时间
- 3、单次时间
- 4. 所有模式
- 总结
前言
jmh用于测试
参考官方github:https://github.com/openjdk/jmh
提示:以下是本篇文章正文内容,下面案例可供参考
一、jmh源码编译
下载jmh1.26版本:https://github.com/openjdk/jmh/releases/tag/1.26,以maven项目引入到对应的IDEA中(此处使用IDEA),并关闭maven的测试,然后进行compile,(或者直接在控制台mvn clean compile -Dmaven.test.skip=true进行编译)直到成功。

进入到jmh-samples子模块当中,选择类JMHSample_01_HelloWorld执行main方法
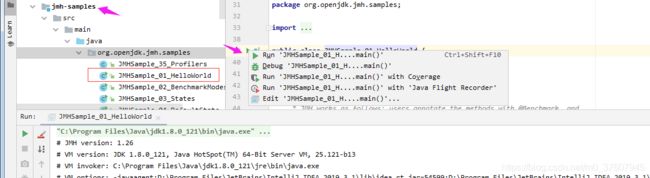
最后运行结果如下
# JMH version: 1.26
# VM version: JDK 1.8.0_121, Java HotSpot(TM) 64-Bit Server VM, 25.121-b13
# VM invoker: C:\Program Files\Java\jdk1.8.0_121\jre\bin\java.exe
# VM options: -javaagent:D:\Program Files\JetBrains\IntelliJ IDEA 2019.3.1\lib\idea_rt.jar=54599:D:\Program Files\JetBrains\IntelliJ IDEA 2019.3.1\bin -Dfile.encoding=UTF-8
# Warmup: 5 iterations, 10 s each
# Measurement: 5 iterations, 10 s each
# Timeout: 10 min per iteration
# Threads: 1 thread, will synchronize iterations
# Benchmark mode: Throughput, ops/time
# Benchmark: org.openjdk.jmh.samples.JMHSample_01_HelloWorld.wellHelloThere
# Run progress: 0.00% complete, ETA 00:01:40
# Fork: 1 of 1
# Warmup Iteration 1: 1857730722.677 ops/s
# Warmup Iteration 2: 1939233575.004 ops/s
# Warmup Iteration 3: 2029207109.027 ops/s
# Warmup Iteration 4: 2453182569.208 ops/s
# Warmup Iteration 5: 1924016723.795 ops/s
Iteration 1: 2064437872.832 ops/s
Iteration 2: 2435374203.949 ops/s
Iteration 3: 1858008951.834 ops/s
Iteration 4: 1954110343.447 ops/s
Iteration 5: 2139800601.483 ops/s
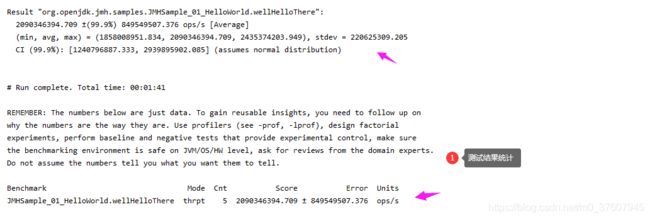
Result "org.openjdk.jmh.samples.JMHSample_01_HelloWorld.wellHelloThere":
2090346394.709 ±(99.9%) 849549507.376 ops/s [Average]
(min, avg, max) = (1858008951.834, 2090346394.709, 2435374203.949), stdev = 220625309.205
CI (99.9%): [1240796887.333, 2939895902.085] (assumes normal distribution)
# Run complete. Total time: 00:01:41
REMEMBER: The numbers below are just data. To gain reusable insights, you need to follow up on
why the numbers are the way they are. Use profilers (see -prof, -lprof), design factorial
experiments, perform baseline and negative tests that provide experimental control, make sure
the benchmarking environment is safe on JVM/OS/HW level, ask for reviews from the domain experts.
Do not assume the numbers tell you what you want them to tell.
Benchmark Mode Cnt Score Error Units
JMHSample_01_HelloWorld.wellHelloThere thrpt 5 2090346394.709 ± 849549507.376 ops/s
jmh源码编译成功。
二、jmh测试案例分析
首先我们来分析上面的案例,源码如下
package org.openjdk.jmh.samples;

import org.openjdk.jmh.annotations.Benchmark;
import org.openjdk.jmh.runner.Runner;
import org.openjdk.jmh.runner.RunnerException;
import org.openjdk.jmh.runner.options.Options;
import org.openjdk.jmh.runner.options.OptionsBuilder;

public class JMHSample_01_HelloWorld {

    /*
     * This is our first benchmark method.
     *
     * JMH works as follows: users annotate the methods with @Benchmark, and
     * then JMH produces the generated code to run this particular benchmark as
     * reliably as possible. In general one might think about @Benchmark methods
     * as the benchmark "payload", the things we want to measure. The
     * surrounding infrastructure is provided by the harness itself.
     *
     * JMH的工作方式:在一个方法上添加@Benchmark注解,JMH会自己生成相应的代码用于测试这个方法。
     * 一般可以认为包含@Benchmark的方法作为我们需要进行测试的主题,而其他负责测试的结构是由jmh自己保证的。
     *
     * Read the Javadoc for @Benchmark annotation for complete semantics and
     * restrictions. At this point we only note that the methods names are
     * non-essential, and it only matters that the methods are marked with
     * @Benchmark. You can have multiple benchmark methods within the same
     * class.
     *
     * 方法名称是不重要的,关键是方法带有@Benchmark注解。在一个类当中可以包含多个@Benchmark方法,
     * 我们可以将包含有这个注解的方法简称为benchmark(基准测试)。
     *
     * Note: if the benchmark method never finishes, then JMH run never finishes
     * as well. If you throw an exception from the method body the JMH run ends
     * abruptly for this benchmark and JMH will run the next benchmark down the
     * list.
     *
     * 如果方法不退出,那么JMH也不会退出,也就是说测试方法无法完成的话,那么JMH也无法完成。
     * 如果方法抛出异常,那么当前的方法测试结束,JMH开始下一个方法的测试。
     *
     * Although this benchmark measures "nothing" it is a good showcase for the
     * overheads the infrastructure bear on the code you measure in the method.
     * There are no magical infrastructures which incur no overhead, and it is
     * important to know what are the infra overheads you are dealing with. You
     * might find this thought unfolded in future examples by having the
     * "baseline" measurements to compare against.
     * 尽管当前的基本测试没有包含任何代码,但是它可以很好展示基础结构在负责测试时的开销。
     * 没有神奇的基础架构不会产生任何开销,因此了解您要处理的基础架构开销很重要。通过比较“基准”度量,
     * 您可能会发现这种想法在以后的示例中得到了体现。
     *
     */

    @Benchmark
    public void wellHelloThere() {
        // this method was intentionally left blank.
    }

    /*
     * ============================== HOW TO RUN THIS TEST: ====================================
     *
     * You are expected to see the run with large number of iterations, and
     * very large throughput numbers. You can see that as the estimate of the
     * harness overheads per method call. In most of our measurements, it is
     * down to several cycles per call.
     *
     * a) Via command-line:
     *    $ mvn clean install
     *    $ java -jar target/benchmarks.jar JMHSample_01
     *
     * JMH generates self-contained JARs, bundling JMH together with it.
     * The runtime options for the JMH are available with "-h":
     *    $ java -jar target/benchmarks.jar -h
     *
     * b) Via the Java API:
     *    (see the JMH homepage for possible caveats when running from IDE:
     *      http://openjdk.java.net/projects/code-tools/jmh/)
     */

    public static void main(String[] args) throws RunnerException {
        Options opt = new OptionsBuilder()
                .include(JMHSample_01_HelloWorld.class.getSimpleName())
                .forks(1)
                .build();

        new Runner(opt).run();
    }

}
在这个代码中绝大部分都是注释(其中的中文是后面加上去的)。只有一个空的方法,然后在上面加上了一个@Benchmark. 虽然简单,也说明了做JMH的工作方式:
1. 一个方法上添加@Benchmark注解,JMH会自己生成相应的代码用于测试这个方法。一般可以认为包含@Benchmark的方法作为我们需要进行测试的主题(playload),而其他负责测试的结构是由jmh自己保证的。这些都是在编译过程中完成的,可以在target/generated-sources查看

2. 方法名称是不重要的,关键是方法带有@Benchmark注解。在一个类当中可以包含多个@Benchmark方法,我们可以将包含有这个注解的方法简称为benchmark(基准测试)。
3. 如果方法不退出,那么JMH也不会退出,也就是说测试方法无法完成的话,那么JMH也无法完成。如果方法抛出异常,那么当前的方法测试结束,JMH开始下一个方法的测试。
4. 尽管当前的基本测试没有包含任何代码,但是它可以很好展示基础结构在负责测试时的开销。没有神奇的基础架构不会产生任何开销,因此了解您要处理的基础架构开销很重要。
Benchmark注解如下,参照注解还可以得出几个重要的结论。

5. 添加这个注解的方法必须是public类型,另外在测试当中不要包含有JMH的相关核心类。除非涉及到State,方法也不能加synchronized关键字。
要运行一个JMH的Benchmark测试,都以下两种方式:
1. 命令行模式
通过maven打包,然后通过java命令运行指令包即可
mvn clean install
java -jar target/benchmarks.jar JMHSample_01
或者添加参数运行
java -jar target/benchmarks.jar -h
2. IDE模式
直接编写一个java的main方法,通过IDE运行即可。这个也是我们在上面运行的方式。
public static void main(String[] args) throws RunnerException {
    Options opt = new OptionsBuilder()
            // 这里包含了要测试的方法即可
            .include(JMHSample_01_HelloWorld.class.getSimpleName())
            .forks(1)
            .build();

    new Runner(opt).run();
}
运行的时候会在控制台打印结果,比如上面的测试结果简要分析

其中的ops/s为每秒操作次数。
参考org.openjdk.jmh.samples.JMHSample_02_BenchmarkModes#measureThroughput,此处在方法中添加延迟,一次需要100ms,这样1s之内可以执行10次,也就是说吞吐量应该为10.
@Benchmark
@BenchmarkMode(Mode.Throughput)
@OutputTimeUnit(TimeUnit.SECONDS)
public void measureThroughput() throws InterruptedException {
    TimeUnit.MILLISECONDS.sleep(100);
}
测试结果如下,环视

另外这里还出现了两个新的注解:org.openjdk.jmh.annotations.BenchmarkMode和org.openjdk.jmh.annotations.OutputTimeUnit。前者用于设置测试的模式,默认值为吞吐量,后者用于设置测试结果的统计单位,默认值为秒。


BenchmarkMode可支持的测试Mode包括以下几种:吞吐量、平均时间、取样时间、单次时间、所有模式。

可支持的时间单位如下

1、平均测试时间
Mode.AverageTime测量平均执行时间,它的执行方式类似于Mode.Throughput。 有人可能会说这是吞吐量的倒数,的确如此。 在某些工作负载中,测量时间更方便。参考源码org.openjdk.jmh.samples.JMHSample_02_BenchmarkModes#measureAvgTime如下
@Benchmark
@BenchmarkMode(Mode.AverageTime)
@OutputTimeUnit(TimeUnit.MICROSECONDS)
public void measureAvgTime() throws InterruptedException {
    TimeUnit.MILLISECONDS.sleep(100);
}


2、采样执行时间
Mode.SampleTime采样执行时间。 在这种模式下,我们仍然在有时间限制的迭代中运行该方法,但是我们没有测量总时间,而是测量了一些基准方法调用所花费的时间。 这使我们能够推断出分布,百分位数等。JMH还尝试自动调整采样频率:如果该方法足够长,最终将捕获所有样本。参考源码org.openjdk.jmh.samples.JMHSample_02_BenchmarkModes#measureSamples如下
@Benchmark
@BenchmarkMode(Mode.SampleTime)
@OutputTimeUnit(TimeUnit.MICROSECONDS)
public void measureSamples() throws InterruptedException {
    TimeUnit.MILLISECONDS.sleep(100);
}
测试结果如下
# JMH version: 1.26
# VM version: JDK 1.8.0_121, Java HotSpot(TM) 64-Bit Server VM, 25.121-b13
# VM invoker: C:\Program Files\Java\jdk1.8.0_121\jre\bin\java.exe
# VM options: -javaagent:D:\Program Files\JetBrains\IntelliJ IDEA 2019.3.1\lib\idea_rt.jar=56175:D:\Program Files\JetBrains\IntelliJ IDEA 2019.3.1\bin -Dfile.encoding=UTF-8
# Warmup: 5 iterations, 10 s each
# Measurement: 5 iterations, 10 s each
# Timeout: 10 min per iteration
# Threads: 1 thread, will synchronize iterations
# Benchmark mode: Sampling time
# Benchmark: org.openjdk.jmh.samples.JMHSample_02_BenchmarkModes.measureSamples

# Run progress: 88.89% complete, ETA 00:01:41
# Fork: 1 of 1
# Warmup Iteration   1: 99963.372 ±(99.9%) 140.605 us/op
# Warmup Iteration   2: 99926.178 ±(99.9%) 42.345 us/op
# Warmup Iteration   3: 99962.061 ±(99.9%) 110.413 us/op
# Warmup Iteration   4: 99942.400 ±(99.9%) 45.343 us/op
# Warmup Iteration   5: 99948.954 ±(99.9%) 123.228 us/op
Iteration   1: 100276.634 ±(99.9%) 971.533 us/op
                 measureSamples·p0.00:   99221.504 us/op
                 measureSamples·p0.50:   99876.864 us/op
                 measureSamples·p0.90:   100125.901 us/op
                 measureSamples·p0.95:   100394.598 us/op
                 measureSamples·p0.99:   127942.001 us/op
                 measureSamples·p0.999:  128188.416 us/op
                 measureSamples·p0.9999: 128188.416 us/op
                 measureSamples·p1.00:   128188.416 us/op

Iteration   2: 99959.439 ±(99.9%) 75.465 us/op
                 measureSamples·p0.00:   99352.576 us/op
                 measureSamples·p0.50:   99876.864 us/op
                 measureSamples·p0.90:   100125.901 us/op
                 measureSamples·p0.95:   100139.008 us/op
                 measureSamples·p0.99:   101317.345 us/op
                 measureSamples·p0.999:  101318.656 us/op
                 measureSamples·p0.9999: 101318.656 us/op
                 measureSamples·p1.00:   101318.656 us/op

Iteration   3: 99927.982 ±(99.9%) 49.305 us/op
                 measureSamples·p0.00:   99221.504 us/op
                 measureSamples·p0.50:   99876.864 us/op
                 measureSamples·p0.90:   100007.936 us/op
                 measureSamples·p0.95:   100007.936 us/op
                 measureSamples·p0.99:   100660.675 us/op
                 measureSamples·p0.999:  100663.296 us/op
                 measureSamples·p0.9999: 100663.296 us/op
                 measureSamples·p1.00:   100663.296 us/op

Iteration   4: 99945.644 ±(99.9%) 88.349 us/op
                 measureSamples·p0.00:   99483.648 us/op
                 measureSamples·p0.50:   99876.864 us/op
                 measureSamples·p0.90:   100007.936 us/op
                 measureSamples·p0.95:   100007.936 us/op
                 measureSamples·p0.99:   102320.046 us/op
                 measureSamples·p0.999:  102367.232 us/op
                 measureSamples·p0.9999: 102367.232 us/op
                 measureSamples·p1.00:   102367.232 us/op

Iteration   5: 99997.450 ±(99.9%) 162.773 us/op
                 measureSamples·p0.00:   99352.576 us/op
                 measureSamples·p0.50:   99876.864 us/op
                 measureSamples·p0.90:   100007.936 us/op
                 measureSamples·p0.95:   100388.045 us/op
                 measureSamples·p0.99:   103275.561 us/op
                 measureSamples·p0.999:  103284.736 us/op
                 measureSamples·p0.9999: 103284.736 us/op
                 measureSamples·p1.00:   103284.736 us/op


Result "org.openjdk.jmh.samples.JMHSample_02_BenchmarkModes.measureSamples":
  N = 501
  mean = 100021.279 ±(99.9%) 193.660 us/op

  Histogram, us/op:
    [ 90000.000,  92500.000) = 0
    [ 92500.000,  95000.000) = 0
    [ 95000.000,  97500.000) = 0
    [ 97500.000, 100000.000) = 283
    [100000.000, 102500.000) = 214
    [102500.000, 105000.000) = 3
    [105000.000, 107500.000) = 0
    [107500.000, 110000.000) = 0
    [110000.000, 112500.000) = 0
    [112500.000, 115000.000) = 0
    [115000.000, 117500.000) = 0
    [117500.000, 120000.000) = 0
    [120000.000, 122500.000) = 0
    [122500.000, 125000.000) = 0
    [125000.000, 127500.000) = 0

  Percentiles, us/op:
      p(0.0000) =  99221.504 us/op
     p(50.0000) =  99876.864 us/op
     p(90.0000) = 100007.936 us/op
     p(95.0000) = 100139.008 us/op
     p(99.0000) = 102367.232 us/op
     p(99.9000) = 128188.416 us/op
     p(99.9900) = 128188.416 us/op
     p(99.9990) = 128188.416 us/op
     p(99.9999) = 128188.416 us/op
    p(100.0000) = 128188.416 us/op
以上的测试通过采样的方式得出测试的时间分布情况。95%都在100139.008us。
3、单次时间
Mode.SingleShotTime测量单个方法的调用时间。 正如Javadoc建议的那样,我们仅执行单个基准测试方法调用。 在这种模式下,迭代时间是没有意义的:基准测试方法停止后,迭代就结束了。 当您特别不想连续调用基准测试方法时,此模式对于进行冷启动测试很有用。参考源码org.openjdk.jmh.samples.JMHSample_02_BenchmarkModes#measureSingleShot如下
@Benchmark
@BenchmarkMode(Mode.SingleShotTime)
@OutputTimeUnit(TimeUnit.MICROSECONDS)
public void measureSingleShot() throws InterruptedException {
    TimeUnit.MILLISECONDS.sleep(100);
}
测试结果如下
# JMH version: 1.26
# VM version: JDK 1.8.0_121, Java HotSpot(TM) 64-Bit Server VM, 25.121-b13
# VM invoker: C:\Program Files\Java\jdk1.8.0_121\jre\bin\java.exe
# VM options: -javaagent:D:\Program Files\JetBrains\IntelliJ IDEA 2019.3.1\lib\idea_rt.jar=56175:D:\Program Files\JetBrains\IntelliJ IDEA 2019.3.1\bin -Dfile.encoding=UTF-8
# Warmup: <none>
# Measurement: 1 iterations, single-shot each
# Timeout: 10 min per iteration
# Threads: 1 thread
# Benchmark mode: Single shot invocation time
# Benchmark: org.openjdk.jmh.samples.JMHSample_02_BenchmarkModes.measureSingleShot

# Run progress: 100.00% complete, ETA 00:00:00
# Fork: 1 of 1
Iteration   1: 99647.600 us/op
可以看到这里根本就没有Warmup。所以说适用于冷启动测试。
4. 所有模式
@Benchmark
@BenchmarkMode({Mode.Throughput, Mode.AverageTime, Mode.SampleTime, Mode.SingleShotTime})
@OutputTimeUnit(TimeUnit.MICROSECONDS)
public void measureMultiple() throws InterruptedException {
    TimeUnit.MILLISECONDS.sleep(100);
}

/*
 * Or even...
 */

@Benchmark
@BenchmarkMode(Mode.All)
@OutputTimeUnit(TimeUnit.MICROSECONDS)
public void measureAll() throws InterruptedException {
    TimeUnit.MILLISECONDS.sleep(100);
}
结果如下
# JMH version: 1.26
# VM version: JDK 1.8.0_121, Java HotSpot(TM) 64-Bit Server VM, 25.121-b13
# VM invoker: C:\Program Files\Java\jdk1.8.0_121\jre\bin\java.exe
# VM options: -javaagent:D:\Program Files\JetBrains\IntelliJ IDEA 2019.3.1\lib\idea_rt.jar=56175:D:\Program Files\JetBrains\IntelliJ IDEA 2019.3.1\bin -Dfile.encoding=UTF-8
# Warmup: <none>
# Measurement: 1 iterations, single-shot each
# Timeout: 10 min per iteration
# Threads: 1 thread
# Benchmark mode: Single shot invocation time
# Benchmark: org.openjdk.jmh.samples.JMHSample_02_BenchmarkModes.measureAll

# Run progress: 100.00% complete, ETA 00:00:00
# Fork: 1 of 1
Iteration   1: 99972.913 us/op


# JMH version: 1.26
# VM version: JDK 1.8.0_121, Java HotSpot(TM) 64-Bit Server VM, 25.121-b13
# VM invoker: C:\Program Files\Java\jdk1.8.0_121\jre\bin\java.exe
# VM options: -javaagent:D:\Program Files\JetBrains\IntelliJ IDEA 2019.3.1\lib\idea_rt.jar=56175:D:\Program Files\JetBrains\IntelliJ IDEA 2019.3.1\bin -Dfile.encoding=UTF-8
# Warmup: <none>
# Measurement: 1 iterations, single-shot each
# Timeout: 10 min per iteration
# Threads: 1 thread
# Benchmark mode: Single shot invocation time
# Benchmark: org.openjdk.jmh.samples.JMHSample_02_BenchmarkModes.measureMultiple

# Run progress: 100.00% complete, ETA 00:00:00
# Fork: 1 of 1
Iteration   1: 100026.463 us/op
在控制台还会打印汇总的测试结果如下(其中包含了测试方法名称、测试模式、循环次数、测试结果、误差范围、结果单位)
Benchmark                                                              Mode  Cnt       Score      Error   Units
JMHSample_02_BenchmarkModes.measureAll                                thrpt    5      ≈ 10⁻⁵             ops/us
JMHSample_02_BenchmarkModes.measureMultiple                           thrpt    5      ≈ 10⁻⁵             ops/us
JMHSample_02_BenchmarkModes.measureThroughput                         thrpt    5       9.972 ±    0.211   ops/s
JMHSample_02_BenchmarkModes.measureAll                                 avgt    5  100157.464 ±  545.369   us/op
JMHSample_02_BenchmarkModes.measureAvgTime                             avgt    5  100440.435 ± 3058.787   us/op
JMHSample_02_BenchmarkModes.measureMultiple                            avgt    5  100017.958 ±   89.780   us/op
JMHSample_02_BenchmarkModes.measureAll                               sample  502   99950.494 ±   43.580   us/op
JMHSample_02_BenchmarkModes.measureAll:measureAll·p0.00              sample        99090.432              us/op
JMHSample_02_BenchmarkModes.measureAll:measureAll·p0.50              sample        99876.864              us/op
JMHSample_02_BenchmarkModes.measureAll:measureAll·p0.90              sample       100007.936              us/op
JMHSample_02_BenchmarkModes.measureAll:measureAll·p0.95              sample       100007.936              us/op
JMHSample_02_BenchmarkModes.measureAll:measureAll·p0.99              sample       101946.491              us/op
JMHSample_02_BenchmarkModes.measureAll:measureAll·p0.999             sample       102891.520              us/op
JMHSample_02_BenchmarkModes.measureAll:measureAll·p0.9999            sample       102891.520              us/op
JMHSample_02_BenchmarkModes.measureAll:measureAll·p1.00              sample       102891.520              us/op
JMHSample_02_BenchmarkModes.measureMultiple                          sample  500  100228.399 ±  892.784   us/op
JMHSample_02_BenchmarkModes.measureMultiple:measureMultiple·p0.00    sample        99090.432              us/op
JMHSample_02_BenchmarkModes.measureMultiple:measureMultiple·p0.50    sample        99876.864              us/op
JMHSample_02_BenchmarkModes.measureMultiple:measureMultiple·p0.90    sample       100007.936              us/op
JMHSample_02_BenchmarkModes.measureMultiple:measureMultiple·p0.95    sample       100139.008              us/op
JMHSample_02_BenchmarkModes.measureMultiple:measureMultiple·p0.99    sample       102102.467              us/op
JMHSample_02_BenchmarkModes.measureMultiple:measureMultiple·p0.999   sample       234618.880              us/op
JMHSample_02_BenchmarkModes.measureMultiple:measureMultiple·p0.9999  sample       234618.880              us/op
JMHSample_02_BenchmarkModes.measureMultiple:measureMultiple·p1.00    sample       234618.880              us/op
JMHSample_02_BenchmarkModes.measureSamples                           sample  501  100021.279 ±  193.660   us/op
JMHSample_02_BenchmarkModes.measureSamples:measureSamples·p0.00      sample        99221.504              us/op
JMHSample_02_BenchmarkModes.measureSamples:measureSamples·p0.50      sample        99876.864              us/op
JMHSample_02_BenchmarkModes.measureSamples:measureSamples·p0.90      sample       100007.936              us/op
JMHSample_02_BenchmarkModes.measureSamples:measureSamples·p0.95      sample       100139.008              us/op
JMHSample_02_BenchmarkModes.measureSamples:measureSamples·p0.99      sample       102367.232              us/op
JMHSample_02_BenchmarkModes.measureSamples:measureSamples·p0.999     sample       128188.416              us/op
JMHSample_02_BenchmarkModes.measureSamples:measureSamples·p0.9999    sample       128188.416              us/op
JMHSample_02_BenchmarkModes.measureSamples:measureSamples·p1.00      sample       128188.416              us/op
JMHSample_02_BenchmarkModes.measureAll                                   ss        99972.913              us/op
JMHSample_02_BenchmarkModes.measureMultiple                              ss       100026.463              us/op
JMHSample_02_BenchmarkModes.measureSingleShot                            ss        99647.600              us/op
总结
本文介绍了jmh源代码的编译,并针对测试案例中的部分测试案例进行了分析。