OpenCV书签 #结构相似性SSIM算法的原理与图片相似性实验
1. 介绍
结构相似性(Structural Similarity,简称SSIM算法),主要用于检测两张相同尺寸的图像的相似度、或者检测图像的失真程度,是一种衡量两幅图像相似度的指标。
定义
给定两个图像 x 和 y,两张图像的结构相似性可按照以下方式求出:

结构相似性的范围为 -1 到 1。当两张图像一模一样时,SSIM的值等于1。
SSIM结构相似度指数,从图像组成的角度将结构信息定义为独立于亮度、对比度的,反映场景中物体结构的属性,并将失真建模为 亮度、对比度和结构 三个不同因素的组合。
- 均值:作为亮度的估计
- 标准差:作为对比度的估计
- 协方差:作为结构相似程度的度量
原理
通过调用 skimage.metrics 包下的 SSIM算法,结合 OpenCV 中的阈值分割及轮廓提取算法,找出两幅图像的差异。
应用
由于SSIM的出色表现,SSIM已经成为广播和有线电视中广为使用的一种衡量视频质量的方法。在超分辨率,图像去模糊中都有广泛的应用。
2. 魔法
通过调用 skimage.metrics 包下的 SSIM 算法,可以快速实现两图 SSIM 结构相似性查找。主要步骤如下:
- 图像预处理: 读取原始图像与匹配图像,并进行图像灰度处理。若两图有宽高差异,则调整图像维度。
- 计算结构相似度: 计算两个灰度图像之间的结构相似度。
- 阈值分割: 可选。对差异图像进行阈值处理,得到一个二值化图像。
- 查找轮廓: 可选。在经过阈值处理后的图像中查找轮廓,并将找到的轮廓绘制在一个新的图像上。
- 提取轮廓: 可选。在新图像上绘制轮廓,将找到的轮廓信息画用指定颜色出来。
- 标记差异: 可选。在检测到的轮廓差异点放置矩形进行标记,并将处理后的两图差异点进行展示。
3. 实验
第一步:图像预处理
读取原始图像与匹配图像,并进行图像灰度处理。若两图有宽高差异,则调整图像维度。
import cv2
import time
import numpy as np
from skimage.metrics import structural_similarity

# 目标图像素材库文件夹路径
database_dir = '../../P0_Doc/img_data/'

# 读取查询图像和数据库中的图像
# img1_path = database_dir + 'iphone15-001.jpg'
# img2_path = database_dir + 'iphone15-002.jpg'
img1_path = database_dir + 'car-101.jpg'
img2_path = database_dir + 'car-102.jpg'

# 读取图像
img1 = cv2.imread(img1_path)
img2 = cv2.imread(img2_path)

# 将图像转换为灰度图像
img1_gray = cv2.cvtColor(img1, cv2.COLOR_BGR2GRAY)
img2_gray = cv2.cvtColor(img2, cv2.COLOR_BGR2GRAY)

# 检查图像形状,保证两个图像必须具有相同的尺寸,即相同的高度和宽度
if img1_gray.shape != img2_gray.shape:
    # 调整图像大小,使它们具有相同的形状
    img2_gray = cv2.resize(img2_gray, (img1_gray.shape[1], img1_gray.shape[0]))
第二步:计算结构相似度
计算两个灰度图像之间的结构相似性指数(SSIM),并输出相似性信息及差异图像。
# 计算两个图像之间的结构相似性指数(Structural Similarity Index,简称SSIM)的函数
(score, diff_img) = structural_similarity(img1_gray, img2_gray, full=True)
# 打印结构相似性指数和差异图像的信息
print(f"两个灰度图像之间的相似性指数:{score}")
print(f"两个灰度图像之间的图像结构差异:\n{diff_img}")
structural_similarity 函数是用于计算两个图像之间的结构相似性指数的函数。
入参:
- img1_gray 和 img2_gray: 输入的两个灰度图像。
- win_size: int or none,可选,滑动窗口的边长,必为奇数,默认值为7,当gaussian_weights=True时,滑动窗口的大小取决于sigma。
- gradient: bool,可选,若为True,返回相对于im2的梯度。
- data_range: float,可选,图像灰度级数,图像灰度的最小值和最大可能值,默认情况根据图像的数据类型进行估计。
- multichannel: bool,可选,值为True时将 img.shape[-1] 视为图像通道数,对每个通道单独计算,取平均值作为相似度。
- gaussian_weights: bool,可选,高斯权重,值为True时,平均值和方差在空间上的权重为归一化高斯核 宽度sigma=1.5。
- full: bool,可选,值为true时,返回详细的相似性信息,包括相似性指数和差异图像
返回: 一个元组结果 (score, diff_img)。
- score: 是计算得到的结构相似性指数,取值范围是 [-1, 1],1 表示两幅图像完全相同,0 表示两者没有结构相似性,-1 表示完全不同。
- diff_img: 是两个图像之间的差异图像。是一个灰度图像,表示两个输入图像的差异,其中更相似的区域为灰度值较低,而不相似的区域为灰度值较高。
小测试
场景一:原图与极近原图
两个灰度图像之间的相似性指数:0.9982306133353187
两个灰度图像之间的图像结构差异:
[[1. 1. 1. ... 1. 1. 1.]
 [1. 1. 1. ... 1. 1. 1.]
 [1. 1. 1. ... 1. 1. 1.]
 ...
 [1. 1. 1. ... 1. 1. 1.]
 [1. 1. 1. ... 1. 1. 1.]
 [1. 1. 1. ... 1. 1. 1.]]
场景二:原图与原图180倒置图
两个灰度图像之间的相似性指数:0.2713534027983612
两个灰度图像之间的图像结构差异:
[[0.45261559 0.47308835 0.46051833 ... 0.63405147 0.63924791 0.64631797]
 [0.44906445 0.4615802  0.4326568  ... 0.64431158 0.64819329 0.65472089]
 [0.45162494 0.46261907 0.44034505 ... 0.62314494 0.63189877 0.6461612 ]
 ...
 [0.6461612  0.63189877 0.62314494 ... 0.44034505 0.46261907 0.45162494]
 [0.65472089 0.64819329 0.64431158 ... 0.4326568  0.4615802  0.44906445]
 [0.64631797 0.63924791 0.63405147 ... 0.46051833 0.47308835 0.45261559]]
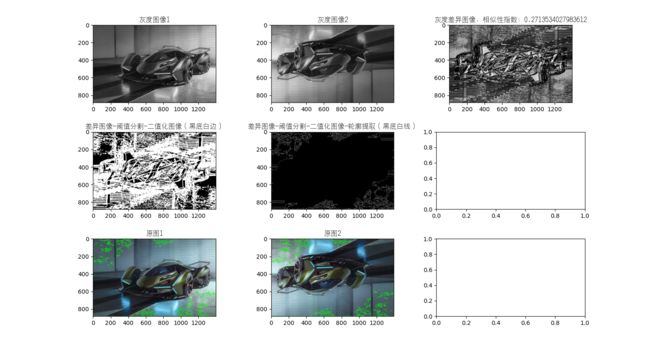
通过简单测试,可以发现 SSIM 算法相当苛刻,原图100%相似;原图180度倒置基本不相似等。
为什么呢?
往下看,我们来找一找茬。
先看看通过上述实验,我们得到的两个图像之间的差异图像。
它是一个灰度图像,表示两个输入图像的差异,其中更相似的区域为灰度值较低,而不相似的区域为灰度值较高。
"""
以图搜图:结构相似性(Structural Similarity,简称SSIM算法)查找相似图像的原理与实现
实验环境:Win10 | python 3.9.13 | OpenCV 4.4.0 | numpy 1.21.1 | Matplotlib 3.7.1
实验时间:2024-01-23
实验目的:使用SSIM查找两图的结构相似性
实例名称:SSIM_v2.2_inline_subplots.py
"""

import os
import time
import cv2
import matplotlib.pyplot as plt
from skimage.metrics import structural_similarity

time_start = time.time()

# 目标图像素材库文件夹路径
database_dir = '../../P0_Doc/img_data/'

# 读取查询图像和数据库中的图像
img1_path = database_dir + 'apple-101.jpg'
img2_path = database_dir + 'apple-102.jpg'

# 读取图像
img1 = cv2.imread(img1_path)
img2 = cv2.imread(img2_path)

# 将图像转换为灰度图像
img1_gray = cv2.cvtColor(img1, cv2.COLOR_BGR2GRAY)
img2_gray = cv2.cvtColor(img2, cv2.COLOR_BGR2GRAY)

# 检查图像形状,保证两个图像必须具有相同的尺寸,即相同的高度和宽度
if img1_gray.shape != img2_gray.shape:
    # 调整图像大小,使它们具有相同的形状
    img2_gray = cv2.resize(img2_gray, (img1_gray.shape[1], img1_gray.shape[0]))

# 计算两个图像之间的结构相似性指数(Structural Similarity Index,简称SSIM)的函数
(score, diff_img) = structural_similarity(img1_gray, img2_gray, full=True)
# 打印结构相似性指数和差异图像的信息
print(f"图像2:{os.path.basename(img2_path)} 与 图像1:{img1_path} 的相似性指数:{score}")
print(f"图像2:{os.path.basename(img2_path)} 与 图像1:{img1_path} 的图像结构差异:\n{diff_img}")

# 将差异图像的像素值缩放到 [0, 255] 范围,并转换数据类型为 uint8,以便显示
diff_img = (diff_img * 255).astype("uint8")

time_end = time.time()
print(f"耗时:{time_end - time_start}")

# 设置 Matplotlib 图像和标题,一行三列水平拼接灰度图像1、灰度图像2、灰度差异图像
fig, axs = plt.subplots(1, 3, figsize=(15, 5))
# 在第一个子图中显示灰度图像1
axs[0].imshow(img1_gray, cmap='gray')
axs[0].set_title('Image 1')
# 在第二个子图中显示灰度图像2
axs[1].imshow(img2_gray, cmap='gray')
axs[1].set_title('Image 2')
# 在第三个子图中显示灰度差异图像
axs[2].imshow(diff_img, cmap='gray')
axs[2].set_title('Difference Image')
# 显示 Matplotlib 图像
plt.show()
输出打印:
图像2:apple-102.jpg 与 图像1:../../P0_Doc/img_data/apple-101.jpg 的相似性指数:0.7278922678915392
图像2:apple-102.jpg 与 图像1:../../P0_Doc/img_data/apple-101.jpg 的图像结构差异:
[[0.999969 0.999969 0.999969 ... 0.999969 0.999969 0.999969]
 [0.999969 0.999969 0.999969 ... 0.999969 0.999969 0.999969]
 [0.999969 0.999969 0.999969 ... 0.999969 0.999969 0.999969]
 ...
 [0.999969 0.999969 0.999969 ... 0.999969 0.999969 0.999969]
 [0.999969 0.999969 0.999969 ... 0.999969 0.999969 0.999969]
 [0.999969 0.999969 0.999969 ... 0.999969 0.999969 0.999969]]
耗时:0.16553020477294922
两个图像之间的差异图像可视化显示效果(一行三列可视化水平拼接灰度图像1、灰度图像2、灰度差异图像):
第三步:阈值分割
可选。对差异图像进行阈值处理,得到一个二值化图像
# 将差异图像进行阈值分割,返回一个经过阈值处理后的二值化图像
# 返回值有两个,第一个是阈值,第二个是二值化图像,这里只取第二个元素
img_threshold = cv2.threshold(diff_img, 0, 255, cv2.THRESH_BINARY_INV | cv2.THRESH_OTSU)[1]

# 打印差异图像进行阈值分割后的二值化图像
# print(f"img_threshold: {img_threshold}")
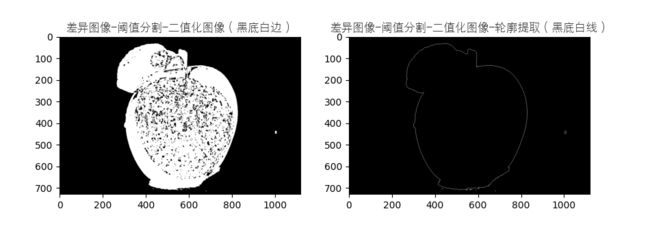
cv2.threshold 用于对图像进行阈值处理。这段代码的效果是显示一幅经过阈值处理的二值化图像,其中通过 Otsu’s 二值化算法将图像分割为两个部分,而 cv2.THRESH_BINARY_INV 反转二进制使得背景为白色,前景(目标)为黑色。
入参:
- diff_img: 输入图像,即两幅图像之间的差异图像
- 0: 阈值
- 255: 如果像素值大于阈值,将其设置为这个值
- cv2.THRESH_BINARY_INV | cv2.THRESH_OTSU: 使用 Otsu’s 二值化算法,结合反转二进制(cv2.THRESH_BINARY_INV)
- [1]: 返回的结果是一个包含两个元素的元组,其中 [1] 取得第二个元素,即处理后的图像
返回: 一个包含两个元素的元组 (ret, thresholded) - ret: 阈值,通常在 Otsu’s 二值化中用不到,因此一般不需要使用这个返回值
- thresholded: 处理后的二值化图像。在代码中使用 [1] 取得这个元组的第二个元素,即 thresholded,作为最终的图像
第四步:查找轮廓
可选。在经过阈值处理后的图像中查找轮廓,并将找到的轮廓绘制在一个新的图像上。
# 在经过阈值处理后的二值化图像中查找轮廓,并将找到的轮廓绘制在一个黑色图像上,使得图像中的轮廓变为白色
# cv2.findContours:用于查找图像中的轮廓
# 返回两个值:img_contours 包含检测到的轮廓,img_hierarchy 包含轮廓的层次结构信息
img_contours, img_hierarchy = cv2.findContours(img_threshold.copy(), cv2.RETR_EXTERNAL, cv2.CHAIN_APPROX_SIMPLE)

# 打印检测到的轮廓信息
# print(f"img contours: {img_contours}")
# print(f"img img_hierarchy: {img_hierarchy}")
这段代码的主要功能是在经过阈值处理后的图像中查找轮廓,并将找到的轮廓绘制在一个黑色图像上,使得图像中的轮廓变为白色。这样做有助于可视化检测到的对象或者区域。
cv2.findContours 用于查找图像中的轮廓。
入参:
- cv2.findContours: 用于查找图像中的轮廓
- img_threshold.copy(): 阈值处理后的二值化图像的副本
- cv2.RETR_EXTERNAL: 表示只检测最外层轮廓,不检测内部轮廓
- cv2.CHAIN_APPROX_SIMPLE: 压缩水平、垂直和对角线方向的元素,只保留其端点,以节省内存
返回:
- img_contours: 包含检测到的轮廓
- img_hierarchy: 包含轮廓的层次结构信息
第五步:提取轮廓
可选。 轮廓提取。在新图像上绘制轮廓,将找到的轮廓信息画用指定颜色出来。
# 轮廓提取:差异图像-阈值分割-二值化图像-轮廓提取(黑底白线)
# 创建一个与阈值处理后的图像相同大小的黑色图像
img_new = np.zeros(img_threshold.shape, np.uint8)
# cv2.drawContours 在新图像上绘制轮廓,将找到的轮廓信息画用指定颜色出来,这里使用的是白色轮廓,轮廓的线宽为1
cv2.drawContours(img_new, img_contours, -1, (255, 255, 255), 1)
cv2.drawContours 函数的功能是在图像上绘制轮廓。
- img_new: 目标图像,表示在这个图像上进行绘制。
- img_contours: 要绘制的轮廓,通常是通过 cv2.findContours 函数得到的轮廓列表。
- -1: 表示绘制所有检测到的轮廓。如果指定一个正整数,表示只绘制具有特定索引的轮廓。
- (255, 255, 255): 绘制轮廓的颜色,这里是白色。颜色是一个包含三个值的元组,分别表示蓝色、绿色和红色通道的强度。
- 1: 绘制轮廓的线宽度。可以根据需要调整线的宽度。
实验代码:
"""
以图搜图:结构相似性(Structural Similarity,简称SSIM算法)查找相似图像的原理与实现
实验环境:Win10 | python 3.9.13 | OpenCV 4.4.0 | numpy 1.21.1 | Matplotlib 3.7.1
实验时间:2024-01-23
实验目的:使用SSIM查找两图的结构相似性,并找出两图差异
实例名称:SSIM_v2.3_inline_subplots.py
"""

import os
import cv2
import time
import numpy as np
import matplotlib.pyplot as plt
from skimage.metrics import structural_similarity
from matplotlib.font_manager import FontProperties

time_start = time.time()

# 目标图像素材库文件夹路径
database_dir = '../../P0_Doc/'
# 字体路径
font_path = database_dir + 'fonts/chinese_cht.ttf'

# 读取查询图像和数据库中的图像
img1_path = database_dir + 'img_data/apple-101.jpg'
img2_path = database_dir + 'img_data/apple-102.jpg'

# 读取图像
img1 = cv2.imread(img1_path)
img2 = cv2.imread(img2_path)

# 将图像转换为灰度图像
img1_gray = cv2.cvtColor(img1, cv2.COLOR_BGR2GRAY)
img2_gray = cv2.cvtColor(img2, cv2.COLOR_BGR2GRAY)

# 检查图像形状,保证两个图像必须具有相同的尺寸,即相同的高度和宽度
if img1_gray.shape != img2_gray.shape:
    # 调整图像大小,使它们具有相同的形状
    img2_gray = cv2.resize(img2_gray, (img1_gray.shape[1], img1_gray.shape[0]))

# 计算两个图像之间的结构相似性指数(Structural Similarity Index,简称SSIM)的函数
(score, diff_img) = structural_similarity(img1_gray, img2_gray, full=True)
# 打印结构相似性指数和差异图像的信息
print(f"图像2:{os.path.basename(img2_path)} 与 图像1:{img1_path} 的相似性指数:{score}")
# print(f"图像2:{os.path.basename(img2_path)} 与 图像1:{img1_path} 的图像结构差异:\n{diff_img}")

# 将差异图像的像素值缩放到 [0, 255] 范围,并转换数据类型为 uint8,以便显示
diff_img = (diff_img * 255).astype("uint8")

# # 设置 Matplotlib 图像和标题,一行三列水平拼接灰度图像1、灰度图像2、灰度差异图像
# fig, axs = plt.subplots(1, 3, figsize=(15, 5))
# # 在第一个子图中显示灰度图像1
# axs[0].imshow(img1_gray, cmap='gray')
# axs[0].set_title('Image 1')
# # 在第二个子图中显示灰度图像2
# axs[1].imshow(img2_gray, cmap='gray')
# axs[1].set_title('Image 2')
# # 在第三个子图中显示灰度差异图像
# axs[2].imshow(diff_img, cmap='gray')
# axs[2].set_title('Difference Image')
# # 显示 Matplotlib 图像
# plt.show()


# 将差异图像进行阈值分割,返回一个经过阈值处理后的二值化图像
# 返回值有两个,第一个是阈值,第二个是二值化图像,这里只取第二个元素
img_threshold = cv2.threshold(diff_img, 0, 255, cv2.THRESH_BINARY_INV | cv2.THRESH_OTSU)[1]

# 打印差异图像进行阈值分割后的二值化图像
# print(f"img_threshold: {img_threshold}")


# 在经过阈值处理后的二值化图像中查找轮廓,并将找到的轮廓绘制在一个黑色图像上,使得图像中的轮廓变为白色
# cv2.findContours:用于查找图像中的轮廓
# 返回两个值:img_contours 包含检测到的轮廓,img_hierarchy 包含轮廓的层次结构信息
img_contours, img_hierarchy = cv2.findContours(img_threshold.copy(), cv2.RETR_EXTERNAL, cv2.CHAIN_APPROX_SIMPLE)

# 打印检测到的轮廓信息
# print(f"img contours: {img_contours}")
# print(f"img img_hierarchy: {img_hierarchy}")


# 轮廓提取:差异图像-阈值分割-二值化图像-轮廓提取(黑底白线)
# 创建一个与阈值处理后的图像相同大小的黑色图像
img_new = np.zeros(img_threshold.shape, np.uint8)
# cv2.drawContours 在新图像上绘制轮廓,将找到的轮廓信息画用指定颜色出来,这里使用的是白色轮廓,轮廓的线宽为1
cv2.drawContours(img_new, img_contours, -1, (255, 255, 255), 1)


time_end = time.time()
print(f"耗时:{time_end - time_start}")

# 设置 Matplotlib 图像和标题,一行两列水平拼接二值化图像(黑底白边)、灰度差异图像
fig, axs = plt.subplots(1, 2, figsize=(10, 5))
# 设置中文字体
font = FontProperties(fname=font_path, size=12)
# 在第一个子图中显示二值化图像(黑底白边)
axs[0].imshow(img_threshold, cmap='gray')
axs[0].set_title('差异图像-阈值分割-二值化图像(黑底白边)', fontproperties=font)
# 在第二个子图中显示绘制图像轮廓(黑底白线)
axs[1].imshow(img_new, cmap='gray')
axs[1].set_title('差异图像-阈值分割-二值化图像-轮廓提取(黑底白线)', fontproperties=font)
# 显示 Matplotlib 图像
plt.show()
输出打印:
图像2:apple-102.jpg 与 图像1:../../P0_Doc/img_data/apple-101.jpg 的相似性指数:0.7278922678915392
耗时:0.16755199432373047
提取轮廓后,可视化 差异图像-阈值分割-二值化图像(黑底白边) 与 差异图像-阈值分割-二值化图像-轮廓提取(黑底白线)效果:
第六步:标记差异
可选。在检测到的轮廓差异点放置矩形进行标记,并将处理后的两图差异点进行展示。
"""
以图搜图:结构相似性(Structural Similarity,简称SSIM算法)查找相似图像的原理与实现
实验环境:Win10 | python 3.9.13 | OpenCV 4.4.0 | numpy 1.21.1 | Matplotlib 3.7.1
实验时间:2024-01-23
实验目的:使用SSIM查找两图的结构相似性,并找出两图差异
实例名称:SSIM_v1.4_inline_subplots.py
"""

import os
import cv2
import time
import numpy as np
import matplotlib.pyplot as plt
from skimage.metrics import structural_similarity
from matplotlib.font_manager import FontProperties

time_start = time.time()

# 目标图像素材库文件夹路径
database_dir = '../../P0_Doc/'
# 字体路径
font_path = database_dir + 'fonts/chinese_cht.ttf'

# 读取查询图像和数据库中的图像
img1_path = database_dir + 'img_data/apple-101.jpg'
img2_path = database_dir + 'img_data/apple-102.jpg'

# 读取图像
img1 = cv2.imread(img1_path)
img2 = cv2.imread(img2_path)

# 将图像转换为灰度图像
img1_gray = cv2.cvtColor(img1, cv2.COLOR_BGR2GRAY)
img2_gray = cv2.cvtColor(img2, cv2.COLOR_BGR2GRAY)

# 检查图像形状,保证两个图像必须具有相同的尺寸,即相同的高度和宽度
if img1_gray.shape != img2_gray.shape:
    # 调整图像大小,使它们具有相同的形状
    img2_gray = cv2.resize(img2_gray, (img1_gray.shape[1], img1_gray.shape[0]))

# 计算两个图像之间的结构相似性指数(Structural Similarity Index,简称SSIM)的函数
(score, diff_img) = structural_similarity(img1_gray, img2_gray, full=True)
# 打印结构相似性指数和差异图像的信息
print(f"图像2:{os.path.basename(img2_path)} 与 图像1:{img1_path} 的相似性指数:{score}")
# print(f"图像2:{os.path.basename(img2_path)} 与 图像1:{img1_path} 的图像结构差异:\n{diff_img}")

# 将差异图像的像素值缩放到 [0, 255] 范围,并转换数据类型为 uint8,以便显示
diff_img = (diff_img * 255).astype("uint8")

# # 设置 Matplotlib 图像和标题,一行三列水平拼接灰度图像1、灰度图像2、灰度差异图像
# fig, axs = plt.subplots(1, 3, figsize=(15, 5))
# # 在第一个子图中显示灰度图像1
# axs[0].imshow(img1_gray, cmap='gray')
# axs[0].set_title('Image 1')
# # 在第二个子图中显示灰度图像2
# axs[1].imshow(img2_gray, cmap='gray')
# axs[1].set_title('Image 2')
# # 在第三个子图中显示灰度差异图像
# axs[2].imshow(diff_img, cmap='gray')
# axs[2].set_title('Difference Image')
# # 显示 Matplotlib 图像
# plt.show()


# 将差异图像进行阈值分割,返回一个经过阈值处理后的二值化图像
# 返回值有两个,第一个是阈值,第二个是二值化图像,这里只取第二个元素
img_threshold = cv2.threshold(diff_img, 0, 255, cv2.THRESH_BINARY_INV | cv2.THRESH_OTSU)[1]

# 打印差异图像进行阈值分割后的二值化图像
# print(f"img_threshold: {img_threshold}")


# 在经过阈值处理后的二值化图像中查找轮廓,并将找到的轮廓绘制在一个黑色图像上,使得图像中的轮廓变为白色
# cv2.findContours:用于查找图像中的轮廓
# 返回两个值:img_contours 包含检测到的轮廓,img_hierarchy 包含轮廓的层次结构信息
img_contours, img_hierarchy = cv2.findContours(img_threshold.copy(), cv2.RETR_EXTERNAL, cv2.CHAIN_APPROX_SIMPLE)

# 打印检测到的轮廓信息
# print(f"img contours: {img_contours}")
# print(f"img img_hierarchy: {img_hierarchy}")


# 轮廓提取:差异图像-阈值分割-二值化图像-轮廓提取(黑底白线)
# 创建一个与阈值处理后的图像相同大小的黑色图像
img_new = np.zeros(img_threshold.shape, np.uint8)
# cv2.drawContours 在新图像上绘制轮廓,将找到的轮廓信息画用指定颜色出来,这里使用的是白色轮廓,轮廓的线宽为1
cv2.drawContours(img_new, img_contours, -1, (255, 255, 255), 1)


# # 设置 Matplotlib 图像和标题,一行两列水平拼接二值化图像(黑底白边)、灰度差异图像
# fig, axs = plt.subplots(1, 2, figsize=(10, 5))
# # 设置中文字体
# font = FontProperties(fname=font_path, size=13)
# # 在第一个子图中显示二值化图像(黑底白边)
# axs[0].imshow(img_threshold, cmap='gray')
# axs[0].set_title('差异图像-阈值分割-二值化图像(黑底白边)', fontproperties=font)

# # 在第二个子图中显示绘制图像轮廓(黑底白线)
# axs[1].imshow(img_new, cmap='gray')
# axs[1].set_title('差异图像-阈值分割-二值化图像-轮廓提取(黑底白线)', fontproperties=font)

# # 显示 Matplotlib 图像
# plt.show()


# 标记差异:在检测到的轮廓差异点放置矩形进行标记,并将处理后的两图差异点进行展示
# 遍历检测到的轮廓列表,在区域周围放置矩形
for ele in img_contours:
    # 使用 cv2.boundingRect 函数计算轮廓的垂直边界最小矩形,得到矩形的左上角坐标 (x, y) 和矩形的宽度 w、高度 h
    (x, y, w, h) = cv2.boundingRect(ele)
    # 使用 cv2.rectangle 函数在原始图像 img1 上画出垂直边界最小矩形,矩形的颜色为绿色 (0, 255, 0),线宽度为2
    cv2.rectangle(img1, (x, y), (x + w, y + h), (0, 255, 0), 2)
    # 使用 cv2.rectangle 函数在原始图像 img2 上画出垂直边界最小矩形,矩形的颜色为绿色 (0, 255, 0),线宽度为2
    cv2.rectangle(img2, (x, y), (x + w, y + h), (0, 255, 0), 2)


time_end = time.time()
print(f"耗时:{time_end - time_start}")

# 设置 Matplotlib 图像和标题,一行两列水平拼接二值化图像(黑底白边)、灰度差异图像
fig, axs = plt.subplots(1, 2, figsize=(10, 5))
# 设置中文字体
font = FontProperties(fname=font_path, size=13)
# 原图显示差异
axs[0].imshow(cv2.cvtColor(img1, cv2.COLOR_BGR2RGB))
axs[0].set_title('img1', fontproperties=font)
axs[1].imshow(cv2.cvtColor(img2, cv2.COLOR_BGR2RGB))
axs[1].set_title('img2', fontproperties=font)
# 显示 Matplotlib 图像
plt.show()
输出打印:
图像2:apple-102.jpg 与 图像1:../../P0_Doc/img_data/apple-101.jpg 的相似性指数:0.7278922678915392
耗时:0.17051458358764648
4. 测试
实验场景
使用SSIM结构相似性查找两图的相似性,并找出两图差异。
实验代码
"""
以图搜图:结构相似性(Structural Similarity,简称SSIM算法)查找相似图像的原理与实现
实验环境:Win10 | python 3.9.13 | OpenCV 4.4.0 | numpy 1.21.1 | Matplotlib 3.7.1
实验时间:2024-01-23
实验目的:使用SSIM查找两图的结构相似性,并找出两图差异
实例名称:SSIM_v1.4_inline_subplots.py
"""

import os
import cv2
import time
import numpy as np
import matplotlib.pyplot as plt
from skimage.metrics import structural_similarity
from matplotlib.font_manager import FontProperties

time_start = time.time()

# 目标图像素材库文件夹路径
database_dir = '../../P0_Doc/'
# 字体路径
font_path = database_dir + 'fonts/chinese_cht.ttf'

# 读取查询图像和数据库中的图像
img1_path = database_dir + 'img_data/apple-101.jpg'
img2_path = database_dir + 'img_data/apple-102.jpg'
img1_path = database_dir + 'img_data/car-101.jpg'
img2_path = database_dir + 'img_data/car-102.jpg'

# 读取图像
img1 = cv2.imread(img1_path)
img2 = cv2.imread(img2_path)

# 将图像转换为灰度图像
img1_gray = cv2.cvtColor(img1, cv2.COLOR_BGR2GRAY)
img2_gray = cv2.cvtColor(img2, cv2.COLOR_BGR2GRAY)

# 检查图像形状,保证两个图像必须具有相同的尺寸,即相同的高度和宽度
if img1_gray.shape != img2_gray.shape:
    # 调整图像大小,使它们具有相同的形状
    img2_gray = cv2.resize(img2_gray, (img1_gray.shape[1], img1_gray.shape[0]))

# 计算两个图像之间的结构相似性指数(Structural Similarity Index,简称SSIM)的函数
(score, diff_img) = structural_similarity(img1_gray, img2_gray, full=True)
# 打印结构相似性指数和差异图像的信息
print(f"图像2:{os.path.basename(img2_path)} 与 图像1:{img1_path} 的相似性指数:{score}")
# print(f"图像2:{os.path.basename(img2_path)} 与 图像1:{img1_path} 的图像结构差异:\n{diff_img}")

# 将差异图像的像素值缩放到 [0, 255] 范围,并转换数据类型为 uint8,以便显示
diff_img = (diff_img * 255).astype("uint8")

# 设置 Matplotlib 图像和标题,一行三列水平拼接灰度图像1、灰度图像2、灰度差异图像
fig, axs = plt.subplots(3, 3, figsize=(15, 5))
# 设置中文字体
font = FontProperties(fname=font_path, size=12)

# 在第一个子图中显示灰度图像1
axs[0][0].imshow(img1_gray, cmap='gray')
axs[0][0].set_title('灰度图像1', fontproperties=font)
# 在第二个子图中显示灰度图像2
axs[0][1].imshow(img2_gray, cmap='gray')
axs[0][1].set_title('灰度图像2', fontproperties=font)
# 在第三个子图中显示灰度差异图像
axs[0][2].imshow(diff_img, cmap='gray')
axs[0][2].set_title(f'灰度差异图像,相似性指数:{score}', fontproperties=font)


# 将差异图像进行阈值分割,返回一个经过阈值处理后的二值化图像
# 返回值有两个,第一个是阈值,第二个是二值化图像,这里只取第二个元素
img_threshold = cv2.threshold(diff_img, 0, 255, cv2.THRESH_BINARY_INV | cv2.THRESH_OTSU)[1]

# 打印差异图像进行阈值分割后的二值化图像
# print(f"img_threshold: {img_threshold}")


# 在经过阈值处理后的二值化图像中查找轮廓,并将找到的轮廓绘制在一个黑色图像上,使得图像中的轮廓变为白色
# cv2.findContours:用于查找图像中的轮廓
# 返回两个值:img_contours 包含检测到的轮廓,img_hierarchy 包含轮廓的层次结构信息
img_contours, img_hierarchy = cv2.findContours(img_threshold.copy(), cv2.RETR_EXTERNAL, cv2.CHAIN_APPROX_SIMPLE)

# 打印检测到的轮廓信息
# print(f"img contours: {img_contours}")
# print(f"img img_hierarchy: {img_hierarchy}")


# 轮廓提取:差异图像-阈值分割-二值化图像-轮廓提取(黑底白线)
# 创建一个与阈值处理后的图像相同大小的黑色图像
img_new = np.zeros(img_threshold.shape, np.uint8)
# cv2.drawContours 在新图像上绘制轮廓,将找到的轮廓信息画用指定颜色出来,这里使用的是白色轮廓,轮廓的线宽为1
cv2.drawContours(img_new, img_contours, -1, (255, 255, 255), 1)


# 第二行用两列水平拼接二值化图像(黑底白边)、灰度差异图像
# 在第一个子图中显示二值化图像(黑底白边)
axs[1][0].imshow(img_threshold, cmap='gray')
axs[1][0].set_title('差异图像-阈值分割-二值化图像(黑底白边)', fontproperties=font)

# 在第二个子图中显示绘制图像轮廓(黑底白线)
axs[1][1].imshow(img_new, cmap='gray')
axs[1][1].set_title('差异图像-阈值分割-二值化图像-轮廓提取(黑底白线)', fontproperties=font)


# 标记差异:在检测到的轮廓差异点放置矩形进行标记,并将处理后的两图差异点进行展示
# 遍历检测到的轮廓列表,在区域周围放置矩形
for ele in img_contours:
    # 使用 cv2.boundingRect 函数计算轮廓的垂直边界最小矩形,得到矩形的左上角坐标 (x, y) 和矩形的宽度 w、高度 h
    (x, y, w, h) = cv2.boundingRect(ele)
    # 使用 cv2.rectangle 函数在原始图像 img1 上画出垂直边界最小矩形,矩形的颜色为绿色 (0, 255, 0),线宽度为2
    cv2.rectangle(img1, (x, y), (x + w, y + h), (0, 255, 0), 2)
    # 使用 cv2.rectangle 函数在原始图像 img2 上画出垂直边界最小矩形,矩形的颜色为绿色 (0, 255, 0),线宽度为2
    cv2.rectangle(img2, (x, y), (x + w, y + h), (0, 255, 0), 2)


time_end = time.time()
print(f"耗时:{time_end - time_start}")

# 第三行用两列水平拼接二值化图像(黑底白边)、灰度差异图像
# 原图显示差异
axs[2][0].imshow(cv2.cvtColor(img1, cv2.COLOR_BGR2RGB))
axs[2][0].set_title('原图1', fontproperties=font)
axs[2][1].imshow(cv2.cvtColor(img2, cv2.COLOR_BGR2RGB))
axs[2][1].set_title('原图2', fontproperties=font)

# 显示 Matplotlib 图像
plt.show()
输出打印:
图像2:car-102.jpg 与 图像1:../../P0_Doc/img_data/car-101.jpg 的相似性指数:0.2713534027983612
耗时:0.6592698097229004
结构相似性可视化效果:
5. 问题
异常现象1
Traceback (most recent call last):
  File "d:\Ct_ iSpace\Wei\Python\iPython\T30_Algorithm\P2_Algo\04_SSIM\SSIM_v1.0.py", line 39, in <module>
    (score, diff) = structural_similarity(img1_gray, img2_gray, full=True)
  File "D:\Tp_Mylocal\20_Install\python-3.9.13\lib\site-packages\skimage\metrics\_structural_similarity.py", line 111, in structural_similarity
    check_shape_equality(im1, im2)
  File "D:\Tp_Mylocal\20_Install\python-3.9.13\lib\site-packages\skimage\_shared\utils.py", line 500, in check_shape_equality
    raise ValueError('Input images must have the same dimensions.')
ValueError: Input images must have the same dimensions.
异常现象2
Traceback (most recent call last):
  File "d:\Ct_ iSpace\Wei\Python\iPython\T30_Algorithm\P2_Algo\04_SSIM\SSIM_v1.2_inline.py", line 58, in <module>
    result_img = np.hstack((img1, img2, diff_img))
  File "<__array_function__ internals>", line 5, in hstack
  File "D:\Tp_Mylocal\20_Install\python-3.9.13\lib\site-packages\numpy\core\shape_base.py", line 345, in hstack
    return _nx.concatenate(arrs, 1)
  File "<__array_function__ internals>", line 5, in concatenate
ValueError: all the input array dimensions for the concatenation axis must match exactly, but along dimension 0, the array at index 0 has size 730 and the array at index 1 has size 1200
问题原因: 这两个错误表明在计算结构相似性(SSIM)时,输入的两个图像 img1_gray 和 img2_gray 的维度不同,它们的形状(shape)必须相同。在计算 SSIM 时,两个图像必须具有相同的尺寸,即相同的高度和宽度。
要解决这个问题,确保 img1_gray 和 img2_gray 的形状相同。你可以使用 shape 属性来检查图像的形状,并根据需要对它们进行调整。
解决方案: 调整图像大小,使它们具有相同的形状.
参考方案: 详见上述 4.测试 的实验代码
# 检查图像形状
if img1_gray.shape != img2_gray.shape:
    # 调整图像大小,使它们具有相同的形状
    img2_gray = cv2.resize(img2_gray, (img1_gray.shape[1], img1_gray.shape[0]))
6. 系列书签
均值哈希算法: OpenCV书签 #均值哈希算法的原理与相似图片搜索实验
感知哈希算法: OpenCV书签 #感知哈希算法的原理与相似图片搜索实验
差值哈希算法: OpenCV书签 #差值哈希算法的原理与相似图片搜索实验
直方图算法: OpenCV书签 #直方图算法的原理与相似图片搜索实验
余弦相似度: OpenCV书签 #余弦相似度的原理与相似图片/相似文件搜索实验


