VTK学习笔记(十三) 画点,画曲线,画柱状图
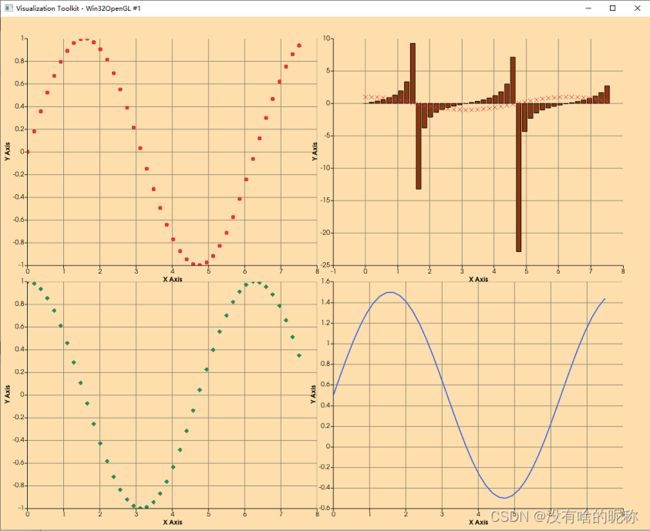
通常来说,各种线图,柱状图是常用的,VTK也提供了方便的绘制方法。如图所示。
四个绘图区域是独立的,可以分别放大缩小,鼠标放到对应点上,也会显示出对应的数据。
代码也不复杂,后面慢慢解释。
#include
#include
#include
#include
#include
#include
#include
#include
#include
#include
#include
#include
#include
#include
#include


#include
VTK_MODULE_INIT(vtkRenderingOpenGL2);
VTK_MODULE_INIT(vtkInteractionStyle);
VTK_MODULE_INIT(vtkRenderingContextOpenGL2);
//----------------------------------------------------------------------------
int main(int, char*[])
{
  vtkNew colors;

  // Set up a 2D scene, add an XY chart to it
  vtkNew view;
  view->GetRenderWindow()->SetSize(1280, 1024);
  view->GetRenderWindow()->SetWindowName("ChartMatrix");

  vtkNew matrix;
  view->GetScene()->AddItem(matrix);
  matrix->SetSize(vtkVector2i(2, 2));
  matrix->SetGutter(vtkVector2f(30.0, 30.0));

  // Create a table with some points in it...
  vtkNew table;
  vtkNew arrX;

  arrX->SetName("X Axis");
  table->AddColumn(arrX);

  vtkNew arrC;
  arrC->SetName("Cosine");
  table->AddColumn(arrC);

  vtkNew arrS;
  arrS->SetName("Sine");
  table->AddColumn(arrS);

  vtkNew arrS2;
  arrS2->SetName("Sine2");
  table->AddColumn(arrS2);

  vtkNew tangent;
  tangent->SetName("Tangent");
  table->AddColumn(tangent);

  int numPoints = 42;
  float inc = 7.5 / (numPoints - 1);
  table->SetNumberOfRows(numPoints);
  for (int i = 0; i < numPoints; ++i)
  {
    table->SetValue(i, 0, i * inc);
    table->SetValue(i, 1, cos(i * inc));
    table->SetValue(i, 2, sin(i * inc));
    table->SetValue(i, 3, sin(i * inc) + 0.5);
    table->SetValue(i, 4, tan(i * inc));
  }

  // Add multiple line plots, setting the colors etc
  // lower left plot, a point chart
  vtkChart* chart = matrix->GetChart(vtkVector2i(0, 0));
  vtkPlot* plot = chart->AddPlot(vtkChart::POINTS);
  plot->SetInputData(table, 0, 1);
  dynamic_cast(plot)->SetMarkerStyle(vtkPlotPoints::DIAMOND);
  plot->GetXAxis()->GetGridPen()->SetColorF(
      colors->GetColor3d("warm_grey").GetData());
  plot->GetYAxis()->GetGridPen()->SetColorF(
      colors->GetColor3d("warm_grey").GetData());
  plot->SetColor(colors->GetColor3ub("sea_green").GetRed(),
                 colors->GetColor3ub("sea_green").GetGreen(),
                 colors->GetColor3ub("sea_green").GetBlue(), 255);

  // upper left plot, a point chart
  chart = matrix->GetChart(vtkVector2i(0, 1));
  plot = chart->AddPlot(vtkChart::POINTS);
  plot->SetInputData(table, 0, 2);
  plot->GetXAxis()->GetGridPen()->SetColorF(
      colors->GetColor3d("warm_grey").GetData());
  plot->GetYAxis()->GetGridPen()->SetColorF(
      colors->GetColor3d("warm_grey").GetData());
  plot->SetColor(colors->GetColor3ub("rose_madder").GetRed(),
                 colors->GetColor3ub("rose_madder").GetGreen(),
                 colors->GetColor3ub("rose_madder").GetBlue(), 255);

  //
  chart = matrix->GetChart(vtkVector2i(1, 0));
  plot = chart->AddPlot(vtkChart::LINE);
  plot->SetInputData(table, 0, 3);
  plot->GetXAxis()->GetGridPen()->SetColorF(
      colors->GetColor3d("warm_grey").GetData());
  plot->GetYAxis()->GetGridPen()->SetColorF(
      colors->GetColor3d("warm_grey").GetData());
  plot->SetColor(colors->GetColor3ub("dark_orange").GetRed(),
                 colors->GetColor3ub("dark_orange").GetGreen(),
                 colors->GetColor3ub("dark_orange").GetBlue(), 255);

  // upper right plot, a bar and point chart
  chart = matrix->GetChart(vtkVector2i(1, 1));
  plot = chart->AddPlot(vtkChart::BAR);
  plot->SetInputData(table, 0, 4);
  plot->GetXAxis()->GetGridPen()->SetColorF(
      colors->GetColor3d("warm_grey").GetData());
  plot->GetYAxis()->GetGridPen()->SetColorF(
      colors->GetColor3d("warm_grey").GetData());
  plot->SetColor(colors->GetColor3ub("burnt_sienna").GetRed(),
                 colors->GetColor3ub("burnt_sienna").GetGreen(),
                 colors->GetColor3ub("burnt_sienna").GetBlue(), 255);

  plot = chart->AddPlot(vtkChart::POINTS);
  plot->SetInputData(table, 0, 1);
  dynamic_cast(plot)->SetMarkerStyle(vtkPlotPoints::CROSS);
  plot->GetXAxis()->GetGridPen()->SetColorF(
      colors->GetColor3d("warm_grey").GetData());
  plot->GetYAxis()->GetGridPen()->SetColorF(
      colors->GetColor3d("warm_grey").GetData());
  plot->SetColor(colors->GetColor3ub("rose_madder").GetRed(),
                 colors->GetColor3ub("rose_madder").GetGreen(),
                 colors->GetColor3ub("rose_madder").GetBlue(), 255);

  // Lower right plot, a line chart
  chart = matrix->GetChart(vtkVector2i(1, 0));
  plot = chart->AddPlot(vtkChart::LINE);
  plot->SetInputData(table, 0, 3);
  plot->GetXAxis()->GetGridPen()->SetColorF(
      colors->GetColor3d("warm_grey").GetData());
  plot->GetYAxis()->GetGridPen()->SetColorF(
      colors->GetColor3d("warm_grey").GetData());
  plot->SetColor(colors->GetColor3ub("dark_orange").GetRed(),
                 colors->GetColor3ub("dark_orange").GetGreen(),
                 colors->GetColor3ub("dark_orange").GetBlue(), 255);

  plot = chart->AddPlot(vtkChart::LINE);
  plot->SetInputData(table, 0, 3);
  plot->GetXAxis()->GetGridPen()->SetColorF(
      colors->GetColor3d("warm_grey").GetData());
  plot->GetYAxis()->GetGridPen()->SetColorF(
      colors->GetColor3d("warm_grey").GetData());
  plot->SetColor(colors->GetColor3ub("royal_blue").GetRed(),
                 colors->GetColor3ub("royal_blue").GetGreen(),
                 colors->GetColor3ub("royal_blue").GetBlue(), 255);

  // Finally render the scene and compare the image to a reference image
  view->GetRenderer()->SetBackground(
      colors->GetColor3d("navajo_white").GetData());
  view->GetRenderWindow()->Render();
  view->GetInteractor()->Initialize();
  view->GetInteractor()->Start();
  return EXIT_SUCCESS;
}