Convolutional Neural Network (CNN) 识别手写数字字体
介绍:
卷积神经网络(Convolutional Neural Network,CNN)是一种在计算机视觉领域广泛应用的深度学习模型。它主要用于图像识别、目标检测、图像分割等任务。
CNN的核心思想是利用卷积操作提取图像的特征。卷积操作是一种基于滤波器的操作,通过滑动窗口在输入图像上提取局部特征,并生成对应的特征图。这种局部感受野的操作可以有效捕捉到图像的空间结构特征,并且具有平移不变性。
CNN的结构由多个卷积层、池化层和全连接层组成。卷积层利用多个卷积核对输入图像进行特征提取,每个卷积核对应一个特征图;池化层通过降采样操作减小特征图的尺寸,并保留最显著的特征;全连接层将特征图映射为输出类别的概率。
训练CNN的过程通常包括前向传播和反向传播两个阶段。前向传播通过将输入数据逐层传递,计算得到最后的输出;反向传播则通过计算损失函数的梯度,更新网络参数,使得网络的输出逼近真实标签。
CNN的优势在于可以自动学习图像的特征表示,并且通过共享参数减少了模型的复杂性。因此,CNN在计算机视觉任务中表现出色,并在许多比赛和应用中取得了优秀的结果。
数据:
# example of loading and plotting the mnist dataset
import os
os.environ["KMP_DUPLICATE_LIB_OK"]="TRUE"
from tensorflow.keras.datasets.mnist import load_data
import numpy as np
import matplotlib.pyplot as plt
import tensorflow as tf
# load dataset
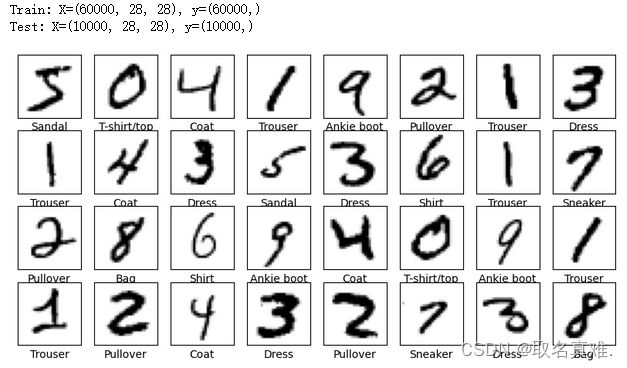
(trainx, trainy), (testx, testy) = load_data()
# summarize loaded dataset
print('Train: X=%s, y=%s' % (trainx.shape, trainy.shape))
print('Test: X=%s, y=%s' % (testx.shape, testy.shape))
class_names=['T-shirt/top','Trouser','Pullover','Dress','Coat','Sandal','Shirt','Sneaker','Bag','Ankie boot']
plt.figure(figsize=(10,10))
for i in range(32):
    plt.subplot(8,8,i+1)
    plt.subplot(8,8,i+1)
    plt.xticks([])
    plt.yticks([])
    plt.grid(False)
    plt.imshow(trainx[i],cmap=plt.cm.binary)
    plt.xlabel(class_names[trainy[i]])
plt.show()
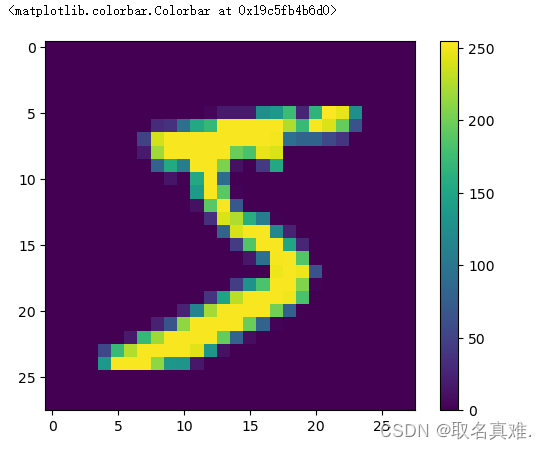
plt.imshow(trainx[0])
plt.colorbar()
# normalize pixel values
#RGB (Red, Green, Blue) are 8 bit each.
#The range for each individual colour is 0-255 (as 2^8 = 256 possibilities).
#By dividing by 255, the 0-255 range can be described with a 0.0-1.0 range where 0.0 means 0 (0x00) and 1.0 means 255 (0xFF).
trainx, testx = trainx/255, testx/255 将像素改成0~1之间的数
模型:
model = tf.keras.models.Sequential([
    tf.keras.layers.Flatten(input_shape=(28,28)),
    tf.keras.layers.Dense(128,activation='relu'),
    tf.keras.layers.Dropout(0.2),
    tf.keras.layers.Dense(10,activation='softmax')
])

model.compile(optimizer='adam',
              loss='sparse_categorical_crossentropy',
              metrics=['accuracy']
             )

model.fit(trainx,trainy,epochs=10)

model.evaluate(testx,testy)
预测:
predictions=model.predict(testx)

predictions[0]
'''结果: 可以看到预测7概率最高,实际上也是7
array([1.6056456e-08, 6.7441119e-09, 6.4127624e-07, 6.7949142e-05,
       1.8204023e-13, 2.6138368e-08, 9.1021393e-19, 9.9992770e-01,
       3.7169819e-08, 3.5297317e-06], dtype=float32)
'''

plt.imshow(testx[0])
def plot_image(i, predictions_array, y_test, img):
predictions_array, y_test, img = predictions_array, y_test[i], img[i]
plt.grid(False)
plt.xticks([])
plt.yticks([])
plt.imshow(img, cmap=plt.cm.binary)
predicted_label = np.argmax(predictions_array)
if predicted_label == y_test:#预测和实际相同
color = 'blue'
else:
color = 'red'
plt.xlabel("{} {:2.0f}% ({})".format(class_names[predicted_label],
100*np.max(predictions_array),
class_names[y_test]),
color=color)
def plot_value_array(i, predictions_array, y_test):
predictions_array, y_test = predictions_array, y_test[i]
plt.grid(False)
plt.xticks(range(10))
plt.yticks([])
thisplot=plt.bar(range(10),predictions_array, color="#777777")
plt.ylim([0,1])
predicted_label=np.argmax(predictions_array)
thisplot[predicted_label].set_color('red')
thisplot[y_test].set_color('blue')rows=4
cols=4
num_images = rows* cols
plt.figure(figsize=(2*2*cols, 2*rows))
for i in range(num_images):
plt.subplot(rows,2*cols,2*i+1)
plot_image(i,predictions[i],testy,testx)
plt.subplot(rows,2*cols,2*i+2)
plot_value_array(i,predictions[i],testy)
plt.tight_layout()
plt.show()


