Backtrader 文档学习-Indicators- TA-Lib
Backtrader 文档学习-Indicators- TA-Lib
1.概述
即使BT提供的内置指标数量已经很多,开发指标主要是定义输入、输出并以自然方式编写公式,还是希望使用TA-LIB。原因:
- 指标X在指标库中,而不在BT中
- TA-LIB众所周知的,人们信任口碑好
应大家需要,BT提供了TA-LIB集成
安装前提:
- 用于TA-Lib的Python包装器
- TA-LIB所需的任何依赖项(例如numpy), 安装细节在GitHub中
2.使用ta-lib
使用BT中已内置的任何指标一样简单。简单移动平均线的示例:
import backtrader as bt

class MyStrategy(bt.Strategy):
    params = (('period', 20),)

    def __init__(self):
        self.sma = bt.indicators.SMA(self.data, period=self.p.period)
        ...

...
ta-lib示例:
import backtrader as bt

class MyStrategy(bt.Strategy):
    params = (('period', 20),)

    def __init__(self):
        self.sma = bt.talib.SMA(self.data, timeperiod=self.p.period)
        ...

...
ta-lib指标的参数是由库本身定义的,而不是由bt定义的。在这种情况下,ta-lib中的SMA采用一个名为timeperiod的参数来定义操作window的大小。
对于需要多个输入参数的指标,例如随机指标:
import backtrader as bt

class MyStrategy(bt.Strategy):
    params = (('period', 20),)

    def __init__(self):
        self.stoc = bt.talib.STOCH(self.data.high, self.data.low, self.data.close,
                                   fastk_period=14, slowk_period=3, slowd_period=3)

        ...

...
Notice how high, low and close have been individually passed. One could always pass open instead of low (or any other data series) and experiment.
The ta-lib indicator documentation is automatically parsed and added to the backtrader docs. You may also check the ta-lib source code/docs. Or adittionally do:
注意最高价、最低价和收盘价是作为参数分别传递的。总是传递开盘价,而不是最低价(或任何其他数据系列)。
ta-lib指标文档被自动解析并添加到bt文档中。可以查看ta-lib源代码/文档:
print(bt.talib.SMA.doc)
输出:
SMA([input_arrays], [timeperiod=30])

Simple Moving Average (Overlap Studies)

Inputs:
    price: (any ndarray)
Parameters:
    timeperiod: 30
Outputs:
    real
文档说明信息:
- 输入参数定义,(忽略“ndarray”注释,因为bt在后台管理转换)
- 有哪些参数,对应默认值
- 指标函数实际提供了哪些输出值
要为bt.talib.STOCH指标选择特定的移动平均线,可通过backtrader.talib.MA_Type访问标准ta-lib MA_Type :
import backtrader as bt
print('SMA:', bt.talib.MA_Type.SMA)
print('T3:', bt.talib.MA_Type.T3)
结果:
SMA: 0
T3: 8
3.用ta-lib绘图
正如常规用法一样,绘制ta-lib指标并没有特别的操作。
注意:
输出蜡烛的指标(所有寻找烛台模式的指标)提供二进制输出:0或100。为了避免在图表中添加子图,有一个自动绘图转换功能,可以在模式被识别的时间点的数据上绘制子图。
(0)在jupyter中实现命令行代码功能
bt给出的示例都是在命令行的方式,通过命令行不同的参数,实现不同功能。找到一个不用修改代码,直接在jupyter中运行的方法:
代码:
#!/usr/bin/env python
# -*- coding: utf-8; py-indent-offset:4 -*-
###############################################################################
#
# Copyright (C) 2015-2023 Daniel Rodriguez
#
# This program is free software: you can redistribute it and/or modify
# it under the terms of the GNU General Public License as published by
# the Free Software Foundation, either version 3 of the License, or
# (at your option) any later version.
#
# This program is distributed in the hope that it will be useful,
# but WITHOUT ANY WARRANTY; without even the implied warranty of
# MERCHANTABILITY or FITNESS FOR A PARTICULAR PURPOSE. See the
# GNU General Public License for more details.
#
# You should have received a copy of the GNU General Public License
# along with this program. If not, see 修改部分:
- 绘图代码
cerebro.plot(iplot=False,**pkwargs)
- 不用main调用
用’–help’.split() ,传递不同的参数。
%matplotlib inline
runstrat('--help'.split())
执行结果:
usage: ipykernel_launcher.py [-h] [--data0 DATA0] [--fromdate FROMDATE]
                             [--todate TODATE]
                             [--ind {sma,ema,stoc,rsi,macd,bollinger,aroon,ultimate,trix,kama,adxr,dema,ppo,tema,roc,williamsr}]
                             [--no-doji] [--use-next] [--plot [kwargs]]

Sample for sizer

optional arguments:
  -h, --help            show this help message and exit
  --data0 DATA0         Data to be read in (default:
                        ./datas/yhoo-1996-2015.txt)
  --fromdate FROMDATE   Starting date in YYYY-MM-DD format (default:
                        2005-01-01)
  --todate TODATE       Ending date in YYYY-MM-DD format (default: 2006-12-31)
  --ind {sma,ema,stoc,rsi,macd,bollinger,aroon,ultimate,trix,kama,adxr,dema,ppo,tema,roc,williamsr}
                        Which indicator pair to show together (default: sma)
  --no-doji             Remove Doji CandleStick pattern checker (default:
                        False)
  --use-next            Use next (step by step) instead of once (batch)
                        (default: False)
  --plot [kwargs], -p [kwargs]
                        Plot the read data applying any kwargs passed For
                        example (escape the quotes if needed): --plot
                        style="candle" (to plot candles) (default: None)
(1)示例和对比
The following are plots comparing the outputs of some ta-lib indicators against the equivalent built-in indicators in backtrader. To consider:
ta-lib指标与bt中相应内置指标绘图对比,考虑:
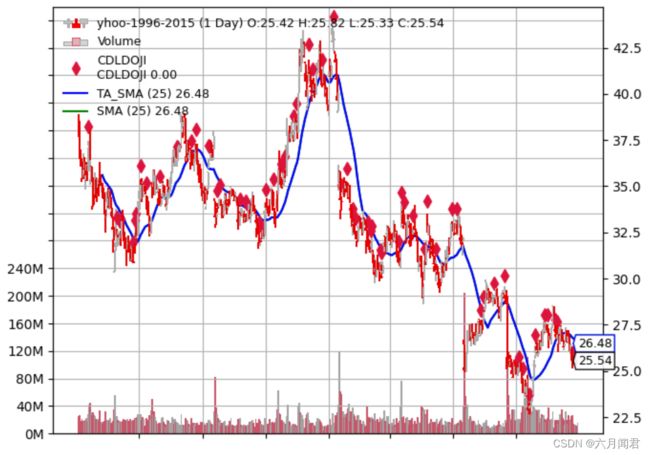
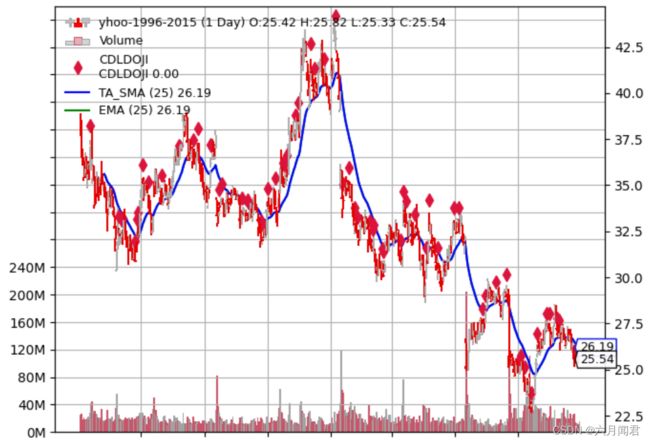
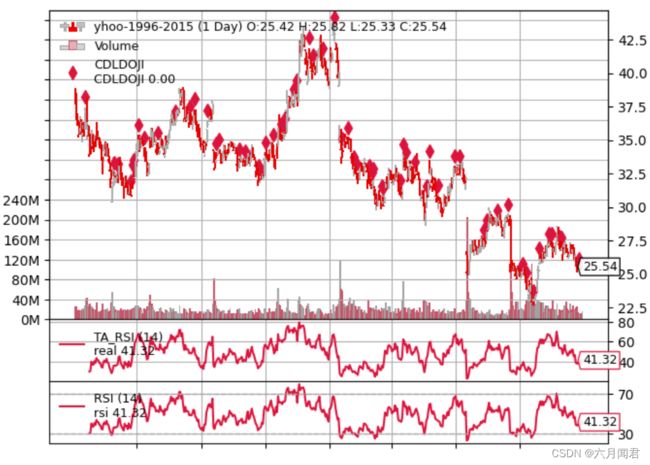
- ta-lib指示器在图上获得一个TA_前缀,示例专门完成的,以帮助用户识别是哪个指标来源,ta还是bt的。
- 移动平均线(如果两者的结果相同)将绘制在另一条现有移动平均线之上。如果这两个指标不能分开,测试通过 。
- 所有示例都包括一个CDLDOJI指示器作为参考
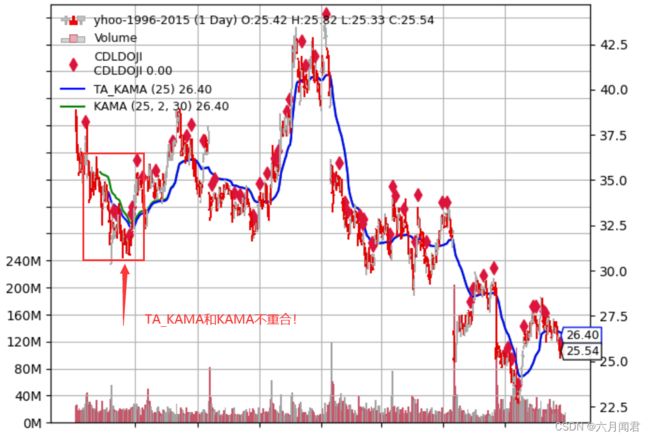
(2)KAMA (Kaufman Moving Average
第一个示例,因为它是唯一有差异的(在bt和ta所有样本的直接比较中):
- 样本的初始值不相同
- 某个时间点,值聚合在一起,两个KAMA实现具有相同的行为。
分析了ta-lib源代码之后: - ta-lib中的实现为KAMA的第一个值做出了非行业标准的选择。
这个不同的选择可以在ta源代码中找到(引用自源代码),使用昨天的价格作为前期的KAMA。
bt做的选择例如从股票软件图表中选择一样
-
股票软件图表中的KAMA
需要一个初始值来开始计算,所以第一个KAMA只是一个简单的移动平均值 -
因此两者有所不同。此外:
ta-lib KAMA实现不允许为Kaufman定义的可伸缩常数的调整指定快速和慢速周期。
测试:
%matplotlib inline
runstrat('--plot --ind kama'.split())
(4)SMA
测试:
%matplotlib inline
runstrat('--plot --ind sma'.split())
(5)EMA
测试:
runstrat(‘–plot --ind ema’.split())
(6)Stochastic
测试:
runstrat(‘–plot --ind stoc’.split())
(7)RSI
测试:
runstrat(‘–plot --ind rsi’.split())
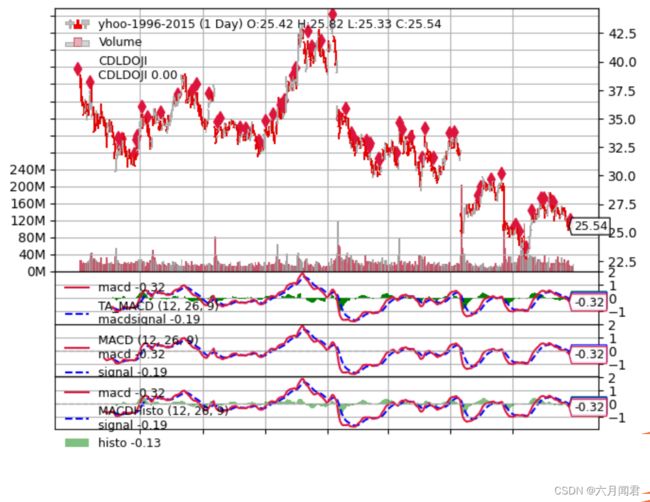
(8)MACD
测试:
runstrat(‘–plot --ind macd’.split())
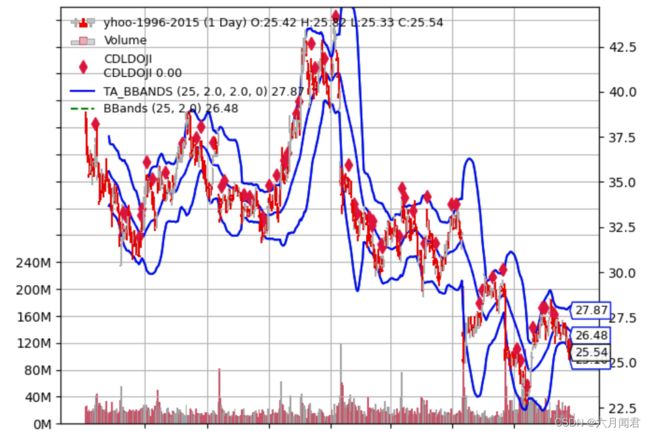
(9)Bollinger Bands
测试:
runstrat(‘–plot --ind bollinger’.split())
报错,花了一些时间找问题。
TypeError: Invalid parameter value for nbdevup (expected float, got int)
源代码:
            bt.talib.BBANDS(self.data, timeperiod=25,
                            plotname='TA_BBANDS')
            bt.indicators.BollingerBands(self.data, period=25)
修改为:
        elif self.p.ind == 'bollinger':
            tbl.BBANDS(self.data, timeperiod=25, nbdevup=2.0,nbdevdn=2.0, matype=0,plotname='TA_BBANDS')
            bt.indicators.BBands(self.data, period=25) #nbdevup=2,nbdevdn=2, matype=0
源代码两处问题:
- 参数应该是float ,调整接口默认是int,所以报错。直接指定浮点数:nbdevup=2.0,nbdevdn=2.0 。
- bt.indicators.BBands 不是bt.indicators.BBANDS ,bt和ta两个的名字大小写不一样 。
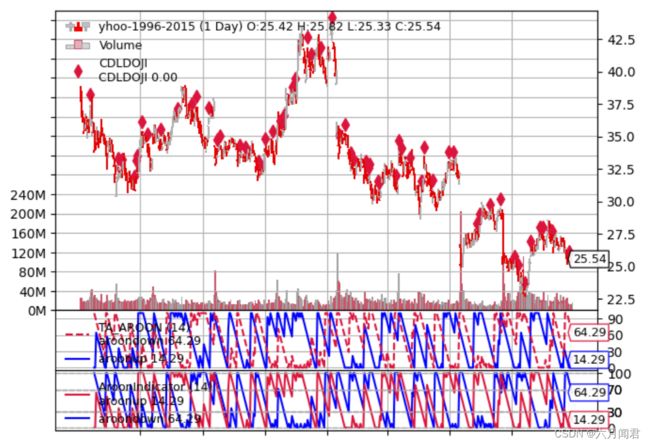
(10)AROON
注意:
ta-lib选择将下行线放在第一位,与backtrader内置指标相比,颜色是相反的。
测试:
runstrat(‘–plot --ind aroon’.split())
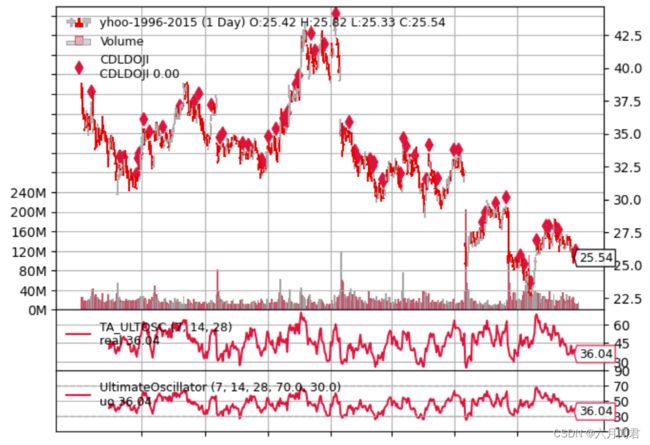
(11)Ultimate Oscillator
测试:
runstrat(‘–plot --ind ultimate’.split())
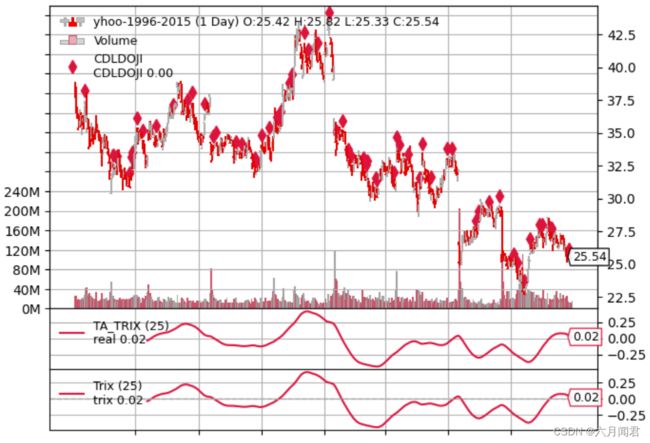
(12)Trix
测试:
runstrat(‘–plot --ind trix’.split())
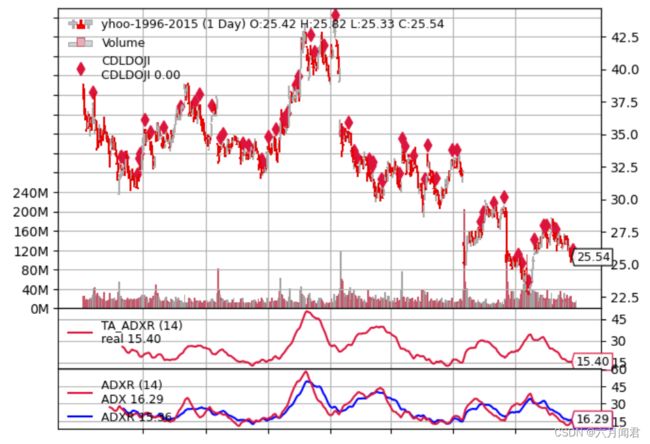
(13)ADXR
测试:
runstrat(‘–plot --ind adxr’.split())
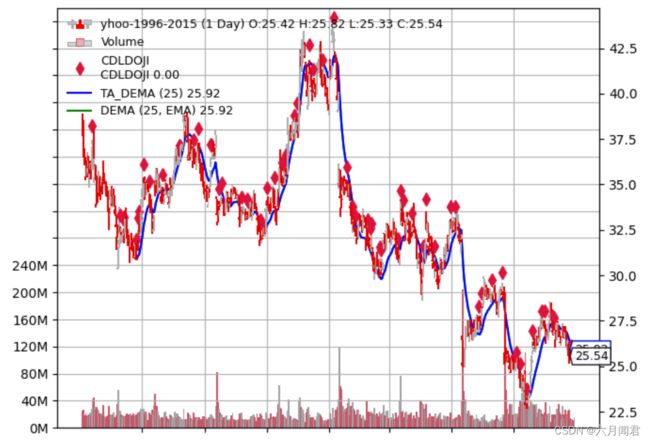
(14)DEMA
测试:
runstrat(‘–plot --ind dema’.split())
(15)TEMA
测试:
runstrat(‘–plot --ind tema’.split())
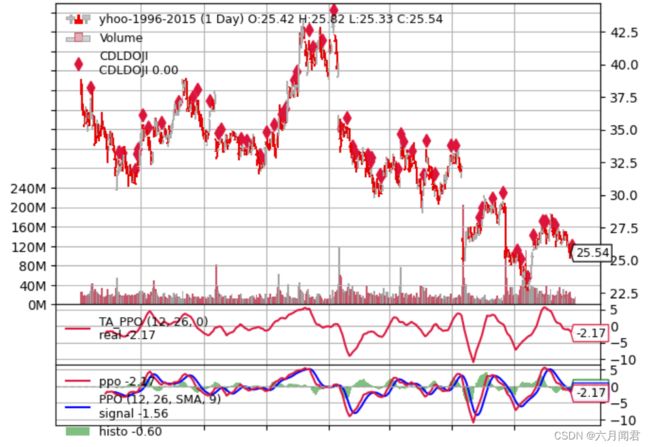
(16)PPO
backtrader不仅提供了ppo线,还提供传统的macd方法。
测试:
runstrat(‘–plot --ind ppo’.split())
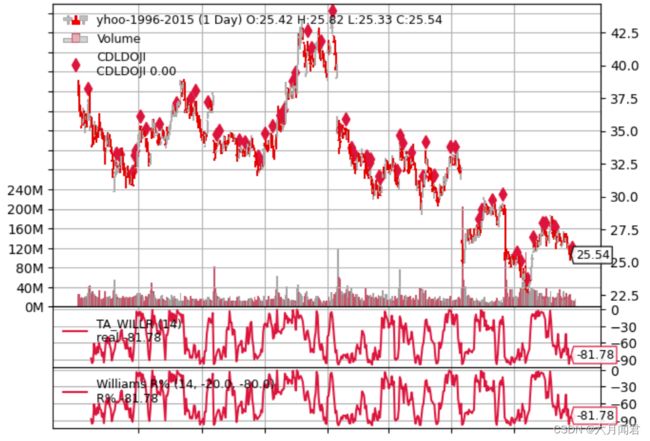
(17)WilliamsR
测试:
runstrat(‘–plot --ind williamsr’.split())
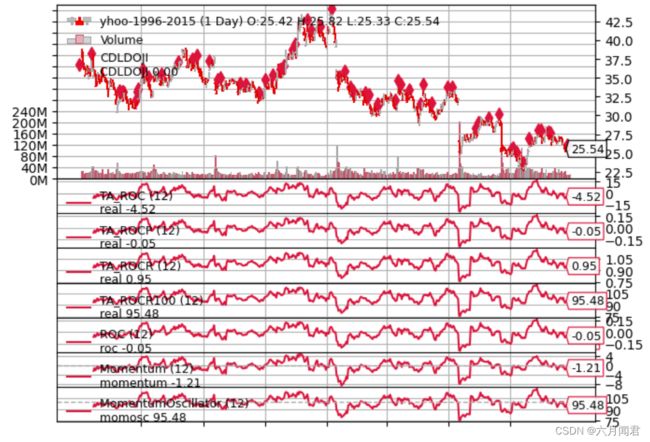
(18)ROC
所有指标显示具有完全相同的形状,但跟踪动量或变化率有几种定义
测试:
runstrat(‘–plot --ind roc’.split())
(20)对比talib和bt.indicator
ind = []
tal = []
for i in dir(bt.indicators):
    if i[:1] != '_' :
        ind.append (i)

for i in dir(bt.talib) :
    if i[:1] != '_' :
        tal.append (i)
print(len(ind)) # 410
print(len(tal)) # 181

tal_notin_ind = []
tal_in_ind = []
for i in tal :
    if i in ind :
        #index = ind.index(i)
        tal_in_ind.append(i)
    else :
        #print(i,' not in ind.')
        tal_notin_ind.append(i)

print('talib in bt indicator:')
print(tal_in_ind)
print('talib not in bt indicator:')
print(tal_notin_ind)
输出结果:
bt indicator 有410属性方法
talib 只有181个属性方法
410
181
talib in bt indicator:
['ADX', 'ADXR', 'APO', 'ATR', 'CCI', 'DEMA', 'EMA', 'KAMA', 'MACD', 'PPO', 'ROC', 'RSI', 'SMA', 'TEMA', 'TRIX', 'WMA', 'absolute_import', 'bt', 'division', 'print_function', 'sys', 'unicode_literals', 'with_metaclass']
talib not in bt indicator:
['ACOS', 'AD', 'ADD', 'ADOSC', 'AROON', 'AROONOSC', 'ASIN', 'ATAN', 'AVGPRICE', 'BBANDS', 'BETA', 'BOP', 'CDL2CROWS', 'CDL3BLACKCROWS', 'CDL3INSIDE', 'CDL3LINESTRIKE', 'CDL3OUTSIDE', 'CDL3STARSINSOUTH', 'CDL3WHITESOLDIERS', 'CDLABANDONEDBABY', 'CDLADVANCEBLOCK', 'CDLBELTHOLD', 'CDLBREAKAWAY', 'CDLCLOSINGMARUBOZU', 'CDLCONCEALBABYSWALL', 'CDLCOUNTERATTACK', 'CDLDARKCLOUDCOVER', 'CDLDOJI', 'CDLDOJISTAR', 'CDLDRAGONFLYDOJI', 'CDLENGULFING', 'CDLEVENINGDOJISTAR', 'CDLEVENINGSTAR', 'CDLGAPSIDESIDEWHITE', 'CDLGRAVESTONEDOJI', 'CDLHAMMER', 'CDLHANGINGMAN', 'CDLHARAMI', 'CDLHARAMICROSS', 'CDLHIGHWAVE', 'CDLHIKKAKE', 'CDLHIKKAKEMOD', 'CDLHOMINGPIGEON', 'CDLIDENTICAL3CROWS', 'CDLINNECK', 'CDLINVERTEDHAMMER', 'CDLKICKING', 'CDLKICKINGBYLENGTH', 'CDLLADDERBOTTOM', 'CDLLONGLEGGEDDOJI', 'CDLLONGLINE', 'CDLMARUBOZU', 'CDLMATCHINGLOW', 'CDLMATHOLD', 'CDLMORNINGDOJISTAR', 'CDLMORNINGSTAR', 'CDLONNECK', 'CDLPIERCING', 'CDLRICKSHAWMAN', 'CDLRISEFALL3METHODS', 'CDLSEPARATINGLINES', 'CDLSHOOTINGSTAR', 'CDLSHORTLINE', 'CDLSPINNINGTOP', 'CDLSTALLEDPATTERN', 'CDLSTICKSANDWICH', 'CDLTAKURI', 'CDLTASUKIGAP', 'CDLTHRUSTING', 'CDLTRISTAR', 'CDLUNIQUE3RIVER', 'CDLUPSIDEGAP2CROWS', 'CDLXSIDEGAP3METHODS', 'CEIL', 'CMO', 'CORREL', 'COS', 'COSH', 'DIV', 'DX', 'EXP', 'FLOOR', 'FUNC_FLAGS_CANDLESTICK', 'FUNC_FLAGS_SAMESCALE', 'FUNC_FLAGS_UNSTABLE', 'HT_DCPERIOD', 'HT_DCPHASE', 'HT_PHASOR', 'HT_SINE', 'HT_TRENDLINE', 'HT_TRENDMODE', 'LINEARREG', 'LINEARREG_ANGLE', 'LINEARREG_INTERCEPT', 'LINEARREG_SLOPE', 'LN', 'LOG10', 'MA', 'MACDEXT', 'MACDFIX', 'MAMA', 'MAVP', 'MAX', 'MAXINDEX', 'MA_Type', 'MEDPRICE', 'MFI', 'MIDPOINT', 'MIDPRICE', 'MIN', 'MININDEX', 'MINMAX', 'MINMAXINDEX', 'MINUS_DI', 'MINUS_DM', 'MOM', 'MULT', 'NATR', 'OBV', 'OUT_FLAGS_DASH', 'OUT_FLAGS_DOTTED', 'OUT_FLAGS_HISTO', 'OUT_FLAGS_LINE', 'OUT_FLAGS_LOWER', 'OUT_FLAGS_UPPER', 'PLUS_DI', 'PLUS_DM', 'ROCP', 'ROCR', 'ROCR100', 'R_TA_FUNC_FLAGS', 'R_TA_OUTPUT_FLAGS', 'SAR', 'SAREXT', 'SIN', 'SINH', 'SQRT', 'STDDEV', 'STOCH', 'STOCHF', 'STOCHRSI', 'SUB', 'SUM', 'T3', 'TAN', 'TANH', 'TRANGE', 'TRIMA', 'TSF', 'TYPPRICE', 'ULTOSC', 'VAR', 'WCLPRICE', 'WILLR', 'np', 'tafunc', 'tafunctions', 'talib']
两者名称完全相同的属性方法:
['ADX', 'ADXR', 'APO', 'ATR', 'CCI', 'DEMA', 'EMA', 'KAMA', 'MACD', 'PPO', 'ROC', 'RSI', 'SMA', 'TEMA', 'TRIX', 'WMA', 'absolute_import', 'bt', 'division', 'print_function', 'sys', 'unicode_literals', 'with_metaclass']
