MIT-BEVFusion系列五--Nuscenes数据集详细介绍,有下载好的图片
一、数据集部分
- mmdetection官方对Nuscenes的中文解释地址:
- https://mmdetection3d.readthedocs.io/zh_CN/latest/advanced_guides/datasets/nuscenes.html
https://www.nuscenes.org/nuscenes#data-format
1.1 数据集概述
nuScenes 数据集 (pronounced /nu:ːsiː:nz/) 是由 Motional (以前称为 nuTonomy) 团队开发的自动驾驶公共大型数据集。nuScenes 数据集的灵感来自于开创性的 KITTI 数据集。 nuScenes 是第一个提供自动驾驶车辆整个传感器套件 (6 个摄像头、1 个 LIDAR、5 个 RADAR、GPS、IMU) 数据的大型数据集。 与 KITTI 相比,nuScenes 包含的对象注释多了 7 倍。为了促进常见的计算机视觉任务 (例如对象检测和跟踪) ,整个数据集中使用 2Hz 的准确 3D 边界框注释 23 个对象类。 此外,还注释了对象级属性,例如可见性、活动和姿势。
2019 年 3 月,Motional 发布了包含全部 1000 个场景(scenes)的完整 nuScenes 数据集。 其中包含大约 140 万张相机图像、39 万张激光雷达扫描、140 万张雷达扫描和 4 万个关键帧中的 140 万个对象边界框。
1.2 数据收集
场景
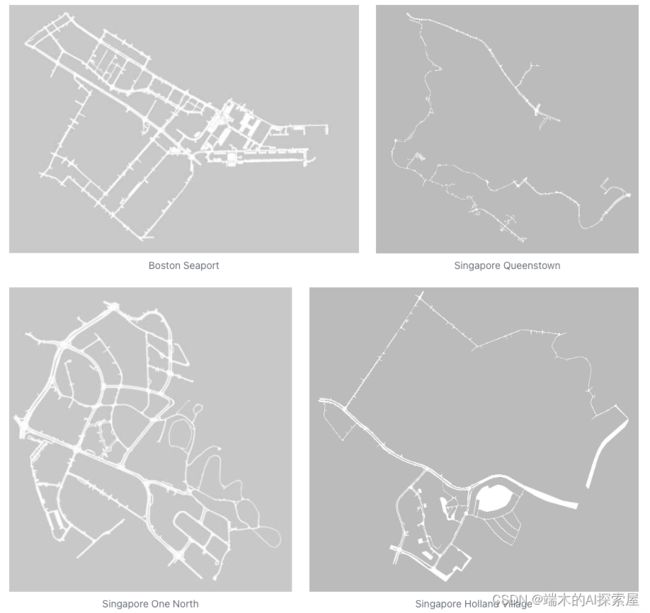
对 nuScenes 数据集,Motional 在波士顿和新加坡收集了大约 15 小时的驾驶数据。完整的数据来自波士顿海港区以及新加坡 One North,Queenstown 和 Holland Village 地区。数据旨在涵盖广泛的地点、时间和天气条件。为了平衡各个类类别的频率分布,还加入了更多包含罕见类 (如自行车) 的场景。根据这些标准,人工选择了 1000 个每个持续 20 秒的场景,这些场景由人工专家进行标注。
传感器设置
传感器标定
为获得高质量的多传感器数据集,每个传感器的 extrinc (外参) 和 intrinsic (内参) 都必须进行标定(calibrate)。将外参坐标表示为相对于自车坐标系的We express extrinsic coordinates relative to the ego frame,也就是车尾中轴的中点。主要步骤描述如下:
- LIDAR 外参数标定:使用激光定线器精确测量 LIDAR 相对于 ego (自车坐标系)的位置。
- Radar 外参数标定:将 Radar 安装在水平位置上,然后在城市环境下收集 Radar 测量数据。在对移动物体进行滤波后,使用暴力方法校准偏航角,以最小化对静态物体的补偿速率。
- Camera 外参数标定:在 Camera 和 LIDAR 传感器前方放置一个立方体形状的校准目标。校准目标由三个具有已知图案的正交平面组成。在检测到这些图案后,通过对齐校准目标的平面来计算从 Camera 到 LIDAR 的转换矩阵。在上述计算得到 LIDAR 到 ego 的转换矩阵之后,可以计算 Camera 到 ego 坐标系的转换矩阵以及相应的外参参数。
- Camera 内参数标定:使用一个具有已知图案集合的校准目标板来推断 Camera 的内参和畸变参数。
传感器同步
为了实现激光雷达和相机之间良好的跨模态数据对齐,当顶部激光雷达扫过相机视野的中心时,触发相机曝光。图像的时间戳是曝光触发时间,而激光雷达扫描的时间戳是当前激光雷达帧完成完整旋转的时间。考虑到相机的曝光时间几乎是瞬时的,这种方法通常能够实现良好的数据对齐。需要注意的是,相机的运行频率为 12 Hz,而激光雷达的运行频率为 20 Hz。这 12 次相机曝光尽可能均匀地分布在 20 次激光雷达扫描中,因此并非所有激光雷达扫描都有相应的相机帧。将相机的帧率降低到 12 Hz有助于减少感知系统的计算、带宽和存储需求。
1.3 数据格式
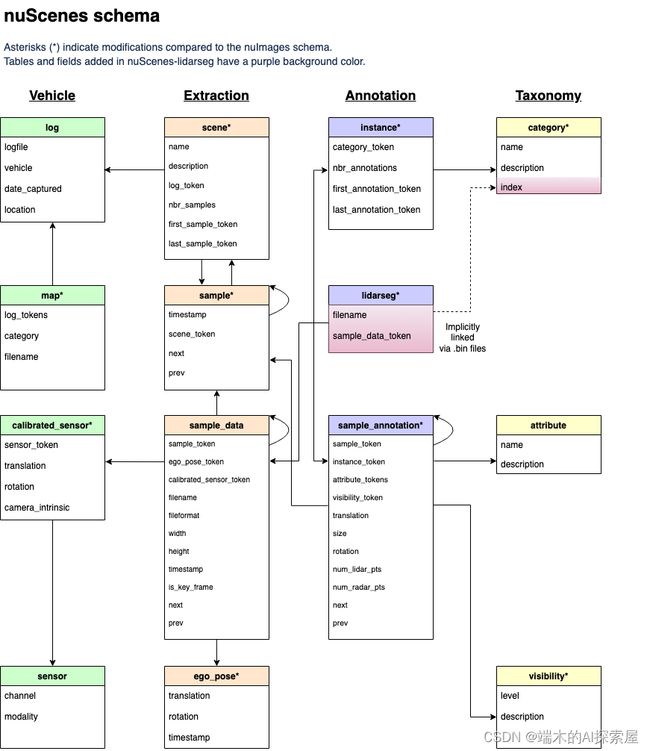
以下是 nuScenes 中使用的数据库模式。所有的标注和元数据 (包括校准、地图、车辆坐标等) 都存储在一个关系型数据库中。每一行都可以通过其唯一的主键标记来进行识别。外键,例如sample_token,可用于与sample表格的标记进行关联。请参考教程,了解数据库表格的介绍。
1.4 数据标注
- 为了精准的表达,重要词汇后面跟了英文。
在收集了驾驶数据后,我们以 2Hz 的频率采样同步良好的关键帧(图像、LIDAR、RADAR)we sample well synchronized keyframes (image, LIDAR, RADAR) at 2Hz ,并将它们发送给我们的标注合作方 Scale 进行标注。通过专家标注人员和多重验证步骤,我们实现了高度精确的标注(highly accurate annotations)。nuScenes 数据集中的所有对象都配有语义类别(semantic category),以及它们出现在每一帧(frame)中的 3D 标注框和属性(D bounding box and attributes)。与 2D 标注框相比,这使我们能够准确地推断出对象在空间中的位置和方向(position and orientation)。
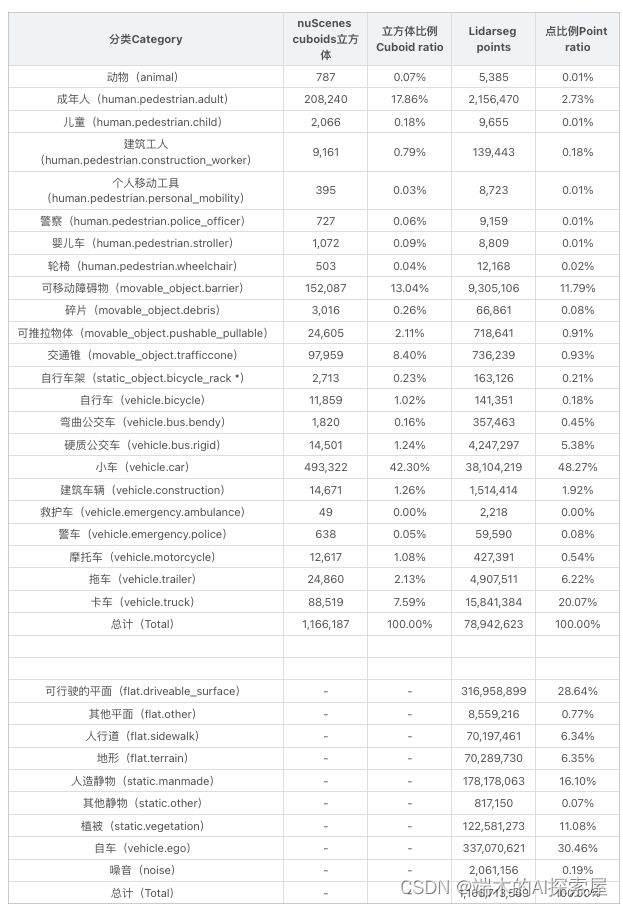
我们为 23 个对象类别提供了真实标签(ground truth labels)。有关每个类别(class)的详细定义和示例图片,请参见标注人员指南。对于完整的 nuScenes 数据集,我们提供以下类别(不包括测试集)的标注:
- 对于 nuScenes-lidarseg,我们为激光雷达点云中的每一个点都标注了一个语义标签(semantic label)。除了来自 nuScenes 的 23 个前景类别(foreground classes)(物体things)外,我们还包括了 9 个背景类别( background classes )(场景stuff)。有关每个类别的详细定义和示例图片,请参见 nuScenes 和 nuScenes-lidarseg 的标注人员指南。我们提供以下类别(不包括测试集)的标注:
接下来是一些具体的标注数据统计,包括各类别的数量和比例等。
- Note that the
static_object.bicycle_rackcategory can include bicycles that are not annotated individually. We use it to ignore large groups of shared bicycles during training to avoid biasing our object detector towards these less interesting bicycles.
Furthermore certain classes in nuScenes have special attributes:
- 请注意,
static_object.bicycle_rack(自行车架)这个分类可能包括没有单独标注的自行车。我们使用这个标签来在训练期间忽略大量的共享自行车,以避免让我们的对象检测器偏向于这些相对不太有趣的自行车。
此外,nuScenes 中的某些类别具有特殊属性:


1.4.1 解释2HZ、12HZ
- 重要性:更进一步理解原始数据。dataset、dataloader中的预处理pipeline才能更容易懂。
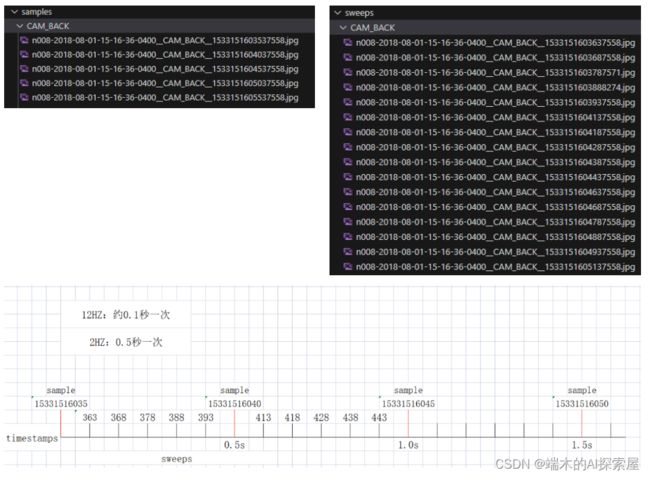
- BEVFusion的lidar数据使用了sweeps+samples的数据,所以可视化出来更密集,效果更好
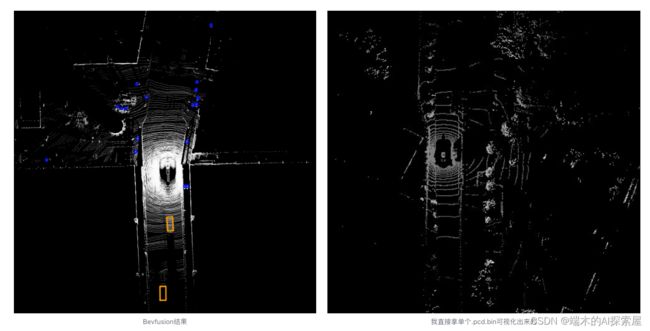
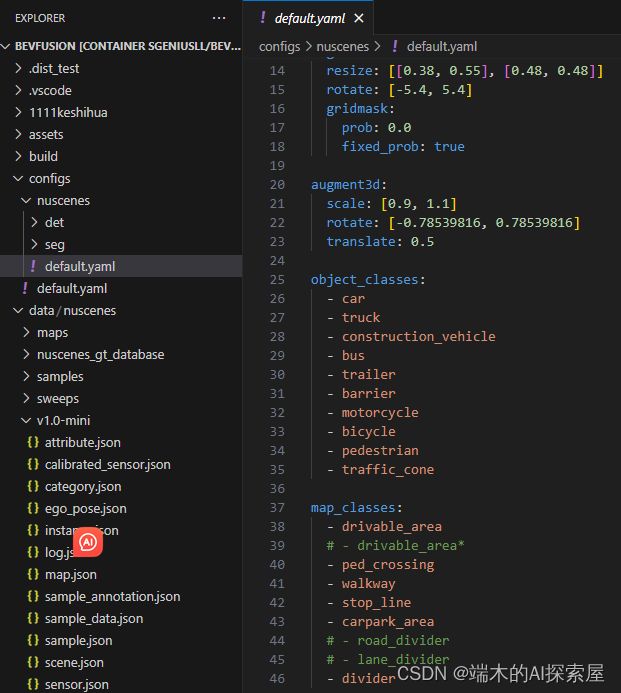
1.4.2 Bevfusion中只用了10个类别
1.5 评价指标
https://arxiv.org/pdf/1903.11027v5.pdf
https://arxiv.org/pdf/2004.08745.pdf CVPR2020(Computer Vision and Pattern Recognition)
https://www.nuscenes.org/object-detection?externalData=all&mapData=all&modalities=Any 评估指标网站
-
mAP 平均精度(mean Average Precision)
-
Average Precision metric. We use the Average Precision (AP) metric [32, 26], but define a match by thresholding the 2D center distance d on the ground plane instead of intersection over union (IOU). This is done in order to decouple detection from object size and orientation but also because objects with small footprints, like pedestrians and bikes, if detected with a small translation error, give 0 IOU (Figure 7). This makes it hard to compare the performance of vision-only methods which tend to have large localization errors [69]. We then calculate AP as the normalized area under the precision recall curve for recall and precision over 10%. Operating points where recall or precision is less than 10% are removed in order to minimize the impact of noise commonly seen in low precision and recall regions. If no operating point in this region is achieved, the AP for that class is set to zero. We then average over matching thresholds of D = {0.5, 1, 2, 4} meters and the set of classes C:
我们使用平均精度(Average Precision, AP)指标[32, 26],通过对地面平面上的2D中心距离d进行阈值化来定义匹配,而不是使用交并比(Intersection over Union, IOU)。这样做是为了将目标检测与对象大小和方向解耦,但也是因为具有小面积的对象(如行人和自行车)如果检测出现小的平移误差,其IOU会为0(见图7)。这使得很难比较倾向于有较大定位误差的仅视觉方法的性能[69]。
然后,我们计算AP作为精度-召回曲线下的归一化面积,其中召回率和精度都超过10%。在召回率或精度低于10%的操作点将被移除,以最小化在低精度和召回区域常见的噪声的影响。如果在这个区域没有达到任何操作点,那么该类别的AP将被设置为零。
最后,我们对匹配阈值D = {0.5, 1, 2, 4}米和一组类别C进行平均。

-
GPT的总结更好
这段文字描述了使用平均精度(Average Precision, AP)作为评价指标的特定方式。在这种情况下,AP并不是通过交并比(Intersection over Union, IoU)来定义匹配,而是通过在地面平面上的2D中心距离(d)来定义。这样做有几个原因:- 解耦检测与对象大小和方向:通过使用2D中心距离作为匹配标准,评价更加集中在检测准确性上,而不是对象的大小或方向。
- 小物体问题:对于像行人和自行车这样的小物体,即使检测有小的平移误差,其IoU也可能为0。这使得很难比较依赖视觉的方法(这些方法往往有较大的定位误差)。
接下来,AP是通过计算召回率(recall)和精度(precision)超过10%的情况下的曲线下面积(Area Under Curve, AUC)来得到的。在召回率或精度低于10%的操作点会被移除,以减少噪声的影响。
如果在这个区域没有达到任何操作点,那么该类别的AP将被设置为零。
最后,这个AP值是通过对一组不同的匹配阈值(D = {0.5, 1, 2, 4}米)和一组不同的类别(C)进行平均来得到的。
简而言之,这种特定的AP计算方式旨在更准确地评估对象检测模型的性能,特别是在处理小物体和定位误差方面。
-
mATE 平均平移误差(Average Translation Error):这是2D中心点之间的欧几里得距离,单位是米。
-
True Positive metrics. In addition to AP, we measure a set of True Positive metrics (TP metrics) for each prediction that was matched with a ground truth box. All TP metrics are calculated using d = 2m center distance during matching, and they are all designed to be positive scalars. In the proposed metric, the TP metrics are all in native units (see below) which makes the results easy to interpret and compare. Matching and scoring happen independently per class and each metric is the average of the cumulative mean at each achieved recall level above 10%. If 10% recall is not achieved for a particular class, all TP errors for that class are set to 1. The following TP errors are defined: Average Translation Error (ATE) is the Euclidean center distance in 2D (units in meters). Average Scale Error (ASE) is the 3D intersection over union (IOU) after aligning orientation and translation (1 − IOU). Average Orientation Error (AOE) is the smallest yaw angle difference between prediction and ground truth (radians). All angles are measured on a full 360◦ period except for barriers where they are measured on a 180◦ period. Average Velocity Error (AVE) is the absolute velocity error as the L2 norm of the velocity differences in 2D (m/s). Average Attribute Error (AAE) is defined as 1 minus attribute classification accuracy (1 − acc). For each TP metric we compute the mean TP metric (mTP) over all classes:

除了平均精度(AP)之外,我们还为每个与地面真实框(ground truth box)匹配的预测测量了一组真正阳性度量(True Positive metrics,简称TP metrics)。所有的TP度量都是在中心距离为2米(d = 2m)的条件下进行匹配计算的,它们都被设计为正标量。在这个提出的度量体系中,所有的TP度量都使用它们的原生单位,这使得结果更容易解释和比较。匹配和评分是针对每个类别独立进行的,每个度量是在召回率(recall)超过10%的各个级别上的累积平均值的平均。如果某个特定类别没有达到10%的召回率,那么该类别的所有TP误差都会被设置为1。
以下是定义的各种TP误差:- 平均平移误差(Average Translation Error,ATE):这是2D中心点之间的欧几里得距离,单位是米。
- 平均尺度误差(Average Scale Error,ASE):这是在方向和平移对齐后的3D交并比(Intersection over Union,IOU),计算为 1 − IOU 1 - \text{IOU} 1−IOU
- 平均方向误差(Average Orientation Error,AOE):这是预测和地面真实值之间最小偏航角度的差异,单位是弧度。所有角度都是在一个完整的360度周期内进行测量的,除了对于障碍物,它们是在一个180度周期内进行测量的。
- 平均速度误差(Average Velocity Error,AVE):这是2D速度差异的L2范数的绝对值,单位是米/秒(m/s)。
- 平均属性误差(Average Attribute Error,AAE):这是定义为 1−属性分类准确度(acc)1−属性分类准确度(acc)
对于每个TP度量,我们都会计算所有类别上的平均TP度量(mean TP metric,mTP)。
这一系列的TP度量提供了一个全面的评估框架,用于衡量对象检测模型在多个方面的性能。
We omit measurements for classes where they are not well defined: AVE for cones and barriers since they are stationary; AOE of cones since they do not have a well defined orientation; and AAE for cones and barriers since there are no attributes defined on these classes.
我们省略了对那些不适用的类别的测量:对于锥体和障碍物,由于它们是静态的,所以不进行平均速度误差(AVE)的测量;对于锥体,由于它们没有明确定义的方向,所以不进行平均方向误差(AOE)的测量;对于锥体和障碍物,由于这些类别没有定义属性,所以不进行平均属性误差(AAE)的测量。
-
mASE平均尺度误差(Average Scale Error):这是在方向和平移对齐后的3D交并比(Intersection over Union,IOU),计算为 1−IOU。
-
mAOE平均方向误差(Average Orientation Error):这是预测和地面真实值之间最小偏航角度的差异,单位是弧度。所有角度都是在一个完整的360度周期内进行测量的,除了对于障碍物,它们是在一个180度周期内进行测量的。
-
mAVE平均速度误差(Average Velocity Error):这是2D速度差异的L2范数的绝对值,单位是米/秒(m/s)。
-
mAAE平均属性误差(Average Attribute Error):这是定义为 1−属性分类准确度(acc)1−属性分类准确度(acc)。
-
NDS(nuScenes detection score)
-
mAP with a threshold on IOU is perhaps the most popular metric for object detection [32, 19, 21]. However, this metric can not capture all aspects of the nuScenes detection tasks, like velocity and attribute estimation. Further, it couples location, size and orientation estimates. The ApolloScape [41] 3D car instance challenge disentangles these by defining thresholds for each error type and recall threshold. This results in 10×3 thresholds, making this approach complex, arbitrary and unintuitive. We propose instead consolidating the different error types into a scalar score: the nuScenes detection score (NDS).
基于IOU阈值的mAP(平均精度)可能是对象检测领域最受欢迎的度量标准。然而,这一度量无法捕捉到nuScenes检测任务的所有方面,比如速度和属性估计。此外,它将位置、大小和方向估计耦合在一起。ApolloScape的3D汽车实例挑战通过为每种错误类型和召回阈值定义阈值来解耦这些因素。这导致了10×3的阈值设置,使这种方法变得复杂、随意且不直观。
我们建议将不同类型的错误合并为一个标量分数:nuScenes检测分数(NDS)。这样做旨在简化评估过程,同时仍然能全面地评估模型在多个方面的性能。
![[图片]](http://img.e-com-net.com/image/info8/efc0822a1c424caaab75aa6a624126d4.jpg)
-
Here mAP is mean Average Precision (1), and TP the set of the five mean True Positive metrics (2). Half of NDS is thus based on the detection performance while the other half quantifies the quality of the detections in terms of box location, size, orientation, attributes, and velocity. Since mAVE, mAOE and mATE can be larger than 1, we bound each metric between 0 and 1 in (3).
这里的mAP是平均精度的均值(1),而TP是五个平均真正阳性(True Positive)度量的集合(2)。因此,NDS(nuScenes检测分数)的一半基于检测性能,而另一半则量化了检测质量,包括框的位置、大小、方向、属性和速度。由于mAVE(平均速度误差)、mAOE(平均方向误差)和mATE(平均平移误差)可能大于1,我们在(3)中将每个度量限制在0和1之间。
这样的设计旨在平衡检测性能和检测质量,使得该评估体系更为全面和准确。 -
PKL(Planning KL-Divergence) 是一种衡量场景中一组检测与地面真实检测有多相似的方式。它通过测量自车(ego car)在仅看到预测对象与实际看到场景中的实际对象的情况下,其规划行为有多大的不同来实现这一点。
让 s 1 , … , s t ∈ S s_1, \ldots, s_t \in S s1,…,st∈S是一系列原始传感器观测值, o 1 ∗ , … , o t ∗ ∈ O o^*_1, \ldots, o^*_t \in O o1∗,…,ot∗∈O 是相应的地面真实对象检测序列, x 1 , … , x t x_1, \ldots, x_t x1,…,xt是自车(ego vehicle)姿态的相应序列。设 A : S → O A : S \rightarrow O A:S→O 是一个对象检测器,它基于 s t s_t st来预测 o t o_t ot。
我们定义时间 t t t处的PKL(Planning KL-Divergence)为
PKL ( A ) = ∑ 0 < Δ ≤ T D K L ( p θ ( x t + Δ ∣ o ≤ t ∗ ) ∣ ∣ p θ ( x t + Δ ∣ A ( s ≤ t ) ) ) \text{PKL}(A) = \sum_{0 < \Delta \leq T} D_{KL}(p_{\theta}(x_{t+\Delta}|o^*_{\leq t}) || p_{\theta}(x_{t+\Delta}|A(s_{\leq t}))) PKL(A)=0<Δ≤T∑DKL(pθ(xt+Δ∣o≤t∗)∣∣pθ(xt+Δ∣A(s≤t)))
其中 p θ ( x t ∣ o ≤ t ) p_{\theta}(x_t|o_{\leq t}) pθ(xt∣o≤t)模型了数据集 D D D中地面真实轨迹的分布。参数 θ \theta θ 是通过以下方式来最小化的:
θ = arg min θ ∑ x t ∈ D − log p θ ( x t ∣ o ≤ t ∗ ) \theta = \arg \min_{\theta} \sum_{x_t \in D} - \log p_{\theta}(x_t|o^*_{\leq t}) θ=argθminxt∈D∑−logpθ(xt∣o≤t∗)
从直观上讲,PKL(Planning KL-Divergence)是一种衡量场景中一组检测与地面真实检测有多相似的方式。它通过测量自车(ego car)在仅看到预测对象与实际看到场景中的实际对象的情况下,其规划行为有多大的不同来实现这一点。
简而言之,PKL度量了预测对象与实际对象之间的差异性,以及这种差异性如何影响自车的路径规划。这是一种有用的度量方式,因为它直接关联到自动驾驶系统如何根据检测结果做出决策。 -
mAPH(Mean average precision weighted by heading)受方向加权的平均精度,未来的预测通常对方向更为敏感
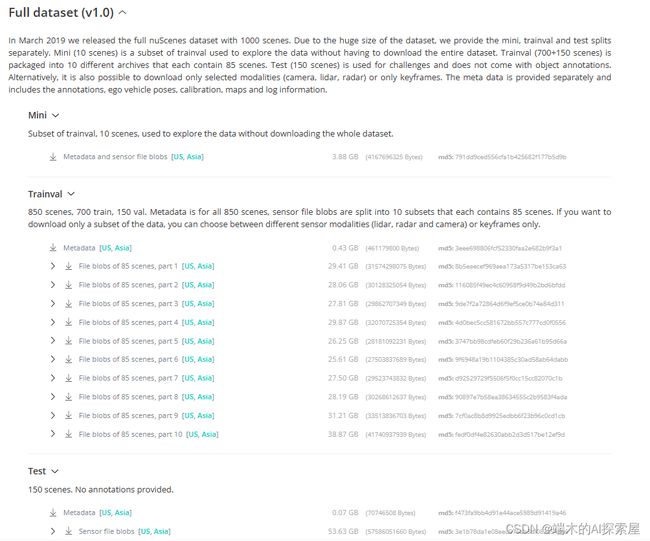
1.6 下载数据集链接
https://www.nuscenes.org/nuscenes#data-format
1.7 数据集官方教程。
- 不需要自己电脑GPU,基本都能跑起来。
https://colab.research.google.com/github/nutonomy/nuscenes-devkit/blob/master/python-sdk/tutorials/nuscenes_tutorial.ipynb
1.8 V1.0-mini数据集解释
1.8.1 json文件作用
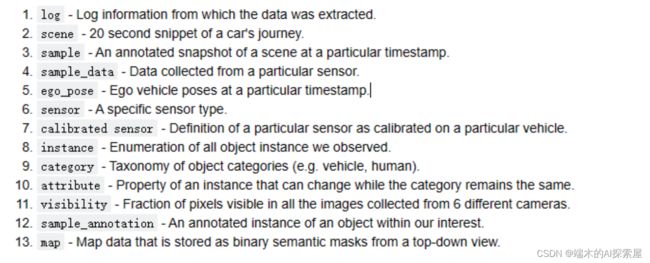
- “log”: 数据集采集的日志数量,记录数据采集过程中的相关信息。
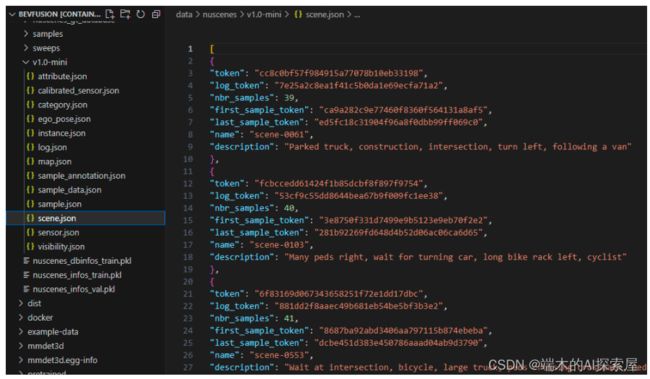
- “scene”: 场景数量,表示数据集中的不同场景或驾驶情景。
- “sample”: 场景在特定时间戳下的一个带标注的快照。
- “sample_data”: 从特定传感器收集的数据。
- “category”: 数据集中的物体类别,例如车辆、行人、自行车等。human.pedestrian.police_officer、vehicle.motorcycle
- “attribute”: 物体属性数量,如颜色、行为等。vehicle.stopped、cycle.without_rider
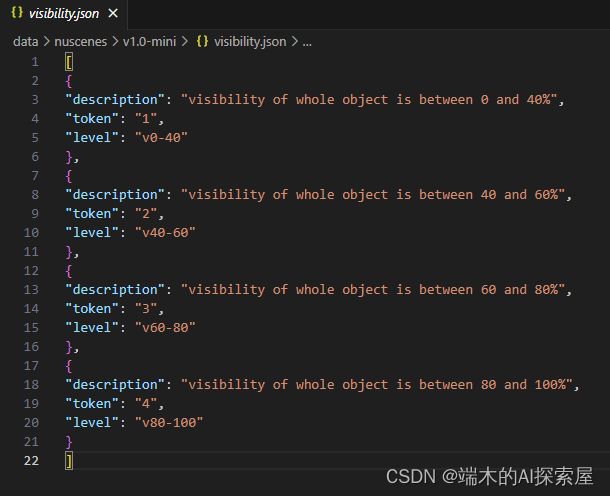
- “visibility”: 物体可见性的数量,用于标识物体在图像中的可见程度。[1, 2, 3, 4]分别代表0-40-60-80-100
- “instance”: 物体实例数量,表示数据集中不同的物体实例。
- “sensor”: 传感器数量,表示用于数据采集的不同传感器设备。6 cam、1 lidar、5 radar
- “calibrated_sensor”: 经过标定的传感器数量,表示传感器的内外参数已经计算得到。
- “ego_pose”: 特定timestamp自车位姿数量,表示车辆自身的位姿信息。rotation、translation表明。
- “sample_annotation”: 包含样本注释数量,表示对样本数据进行的标注,如物体边界框3D Bounding Box、属性等。(关键帧标注)
- “map”: 以二进制语义掩码形式存储的自顶向下视图的地图数据。
1.7.2 官方网页可交互
https://www.nuscenes.org/nuscenes?sceneId=scene-0011&frame=0&view=regular

1.9 总结
- 数据集使用Nuscenes数据集V1.0-mini
- V1.0-mini数据有10个scenes。8个用于训练,2个用于测试。
- V1.0-mini有404个sample,81个用于测试。
- camera原始数据大小:1600*900
- sample与sweeps
- 23个类别,Bevfusion中只用了10个类别。
