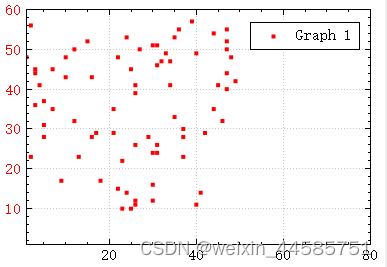
QcustomPlot绘制动态点位,这些点位数据是随机数生成的
QT中使用QcustomPlot绘制动态点位,这些点位数据是随机数生成的。
#include "mainwindow.h"
#include "ui_mainwindow.h"

MainWindow::MainWindow(QWidget *parent)
    : QMainWindow(parent)
    , ui(new Ui::MainWindow)
{
    ui->setupUi(this);


    ui->widget_4->legend->setVisible(true);
    ui->widget_4->legend->setFont(QFont("Helvetica", 9));
    QPen pen;


    ui->widget_4->addGraph();
    pen.setWidth(4);
    pen.setColor(Qt::red);
    ui->widget_4->graph()->setPen(pen);
   // customPlot->graph()->setName(lineNames.at(i - QCPGraph::lsNone));
    ui->widget_4->graph()->setLineStyle((QCPGraph::LineStyle)0);//设置线性
    ui->widget_4->graph()->setScatterStyle(QCPScatterStyle(QCPScatterStyle::ssDot, 4));//设置每个节点数据绘制风格,默认是空,这里设置为空心圆

    // zoom out a bit:
    ui->widget_4->yAxis->setRange(1, 60);
    ui->widget_4->xAxis->setRange(1, 80);
    ui->widget_4->yAxis->setLabelColor(Qt::red);
    ui->widget_4->yAxis->setLabelColor(Qt::red);
    // set blank axis lines:
    ui->widget_4->xAxis->setTicks(true);//x轴不显示刻度
    ui->widget_4->yAxis->setTicks(true);//y轴显示刻度
    ui->widget_4->xAxis->setTickLabels(true);//x轴不显示文本
    ui->widget_4->yAxis->setTickLabels(true);//y轴显示文本
    ui->widget_4->yAxis->setTickLabelColor(Qt::red);
    ui->widget_4->xAxis->setLabelColor(Qt::red);
    // make top right axes clones of bottom left axes:
    ui->widget_4->axisRect()->setupFullAxesBox();//一个默认的坐标轴矩形配置,包括:顶部坐标轴跟随底部坐标轴同步、右侧坐标轴跟随左侧坐标轴同步,不仅仅是坐标轴范围跟随同步,包括文本精度、文本格式、坐标轴类型、是否自动生成刻度、刻度间距等等。
//     demoStyle_4(ui->widget_4);
    // 运行示例代码,大部分参照别人博客,以附链接
//    demoStyle_1(pGraph1);
//    demoStyle_2(pGraph2);
//    demoStyle_3(pGraph3);
    m_X.clear();
    m_Y.clear();
    timerTick = new QTimer(this);
    connect(timerTick, &QTimer::timeout,this,&MainWindow::slot_Update_Line);
    timerTick->start(500);
}

//设置随机数,填充随机数x、y值,然后设置点位,就可以显示了。
void MainWindow::slot_Update_Line()
{
    qsrand(QTime(0,0,0).secsTo(QTime::currentTime()));          //设置随机数种子
    int rand = qrand() % 100;
    m_X.resize(rand);
    m_Y.resize(rand);
    for(int i=0; i<rand; i++){
        m_X.append(qrand() % 50);
        m_Y.append(qrand() % 50 + 10);
    }
    ui->widget_4->graph()->setData(m_X,m_Y);
        //customPlot->graph()->rescaleAxes(true);//坐标轴自适应
  ui->widget_4->replot(QCustomPlot::rpQueuedReplot);//刷新界面,这个必须要添加,否则不能刷新点位,达不到动态效果
}


MainWindow::~MainWindow()
{
    delete ui;
}

// 样式参照:https://www.cnblogs.com/jeffkuang/articles/6477790.html
void MainWindow::demoStyle_1(QCustomPlot *customPlot)
{
    // 样式参照:https://www.cnblogs.com/jeffkuang/articles/6477790.html
    // 设置坐标轴标签名称
    customPlot->xAxis->setLabel("x");
    customPlot->yAxis->setLabel("y");

    // 设置坐标轴显示范围,默认范围为 0~5
    customPlot->xAxis->setRange(-11, 11);
    customPlot->yAxis->setRange(-1100, 1100);

    // 设置背景色
    customPlot->setBackground(QColor(50, 50, 50));

    // 设置x轴文本色、轴线色、字体等
    customPlot->xAxis->setTickLabelColor(Qt::white);
    customPlot->xAxis->setLabelColor(QColor(0, 160, 230));
    customPlot->xAxis->setBasePen(QPen(QColor(32, 178, 170)));
    customPlot->xAxis->setTickPen(QPen(QColor(128, 0, 255)));
    customPlot->xAxis->setSubTickPen(QColor(255, 165, 0));
    QFont xFont = customPlot->xAxis->labelFont();
    xFont.setPixelSize(20);
    customPlot->xAxis->setLabelFont(xFont);

    // 设置y轴文本色、轴线色、字体等
    customPlot->yAxis->setTickLabelColor(Qt::white);
    customPlot->yAxis->setLabelColor(QColor(0, 160, 230));
    customPlot->yAxis->setBasePen(QPen(QColor(32, 178, 170)));
    customPlot->yAxis->setTickPen(QPen(QColor(128, 0, 255)));
    customPlot->yAxis->setSubTickPen(QColor(255, 165, 0));
    QFont yFont = customPlot->yAxis->labelFont();
    yFont.setPixelSize(20);
    customPlot->yAxis->setLabelFont(yFont);


    // 向绘图区域QCustomPlot添加一条曲线
    QCPGraph *pGraph = customPlot->addGraph();
    // 设置曲线颜色
    pGraph->setPen(QPen(QColor(32, 178, 170)));
    // 可变数组存放绘图的坐标的数据,分别存放x和y坐标的数据,101为数据长度
    QVector<double> x(101), y(101);
    // 添加数据,这里演示y = x^3,为了正负对称,x从-10到+10
    for (int i = 0; i < 101; ++i)
    {
        x[i] = i/5 - 10;
        y[i] = qPow(x[i], 3);  // x的y次方;
    }
    // 添加数据
    customPlot->graph(0)->setData(x, y);


    // 导出图片
    customPlot->savePng("customPlot.png", 480, 320);
}

// 样式参照:http://voidcat.cn/index.php/2018/12/10/qcustomplot/
void MainWindow::demoStyle_2(QCustomPlot *customPlot)
{
    QVector<double> x, y;
    for (double i=-10; i <= 10; i=i+0.1)
    {
        double x1 = i;
        double y1 = qSin(i) * 100;
        x.append(x1);
        y.append(y1);
    }
    customPlot->addGraph();
    customPlot->graph(0)->setPen(QPen(Qt::red));
    customPlot->graph(0)->setLineStyle(QCPGraph::lsImpulse);
    //customPlot->graph(0)->setLineStyle(QCPGraph::lsStepCenter);// 搜LineStyle:lsNone,lsLine(默认的,连线),lsStepLeft,lsStepRight,lsStepCenter,lsImpulse
    customPlot->graph(0)->setData(x, y);
    customPlot->xAxis->setLabel("time");
    customPlot->yAxis->setLabel("value");
    customPlot->xAxis->setRange(-10, 10);
    customPlot->yAxis->setRange(-100, 100);
}

void MainWindow::demoStyle_3(QCustomPlot *customPlot)
{
    // 设置坐标轴标签名称
    customPlot->xAxis->setLabel("x");
    customPlot->yAxis->setLabel("y");

    // 设置坐标轴显示范围,不设置时默认范围为 0~5
    customPlot->xAxis->setRange(-10, 10);
    customPlot->yAxis->setRange(-100, 100);

    /// 添加曲线有两种方法
    /// 第一种直接插入,使用控件的曲线数组 graph()。但要注意:曲线从 graph(0)开始递增的,超出添加的个数使用会报错。不推荐这种方式,容易搞错。
    // 添加一条绘图曲线
    customPlot->addGraph();
    // 设置曲线颜色
    customPlot->graph(0)->setPen(QPen(QColor(255, 0, 0)));
    // 曲线的坐标数据,计算x和y的坐标
    QVector<double> x(201), y(201);
    for (int i = 0; i < 201; ++i)
    {
        x[i] = -10 + 0.1f *i;
        y[i] = sin(x[i])*50;  // y = 50sinx
    }
    // 设置曲线的坐标数据
    customPlot->graph(0)->setData(x, y);
    // 添加一条绘图曲线
    QCPGraph *pGraph2 = customPlot->addGraph();/// 这行代码等同于 customPlot->addGraph(); QCPGraph *pGraph2 = customPlot->graph(1);
    // 设置曲线颜色
    pGraph2->setPen(QPen(QColor(0, 0, 255)));
    // 曲线的坐标数据,计算x和y的坐标
    QVector<double> x1(201), y1(201);
    for (int i = 0; i < 201; ++i)
    {
        x1[i] = -10 + 0.1f *i;
        y1[i] = cos(x1[i])*50;  // y = 50cosx
    }
    // 设置曲线的坐标数据
    pGraph2->setData(x1, y1);
}
