notes: the architecture of GDB
1. gdb structure

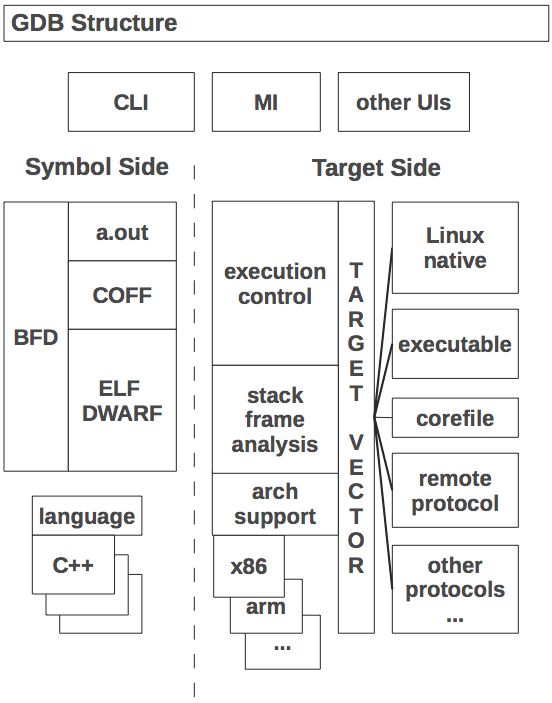
at the largest scale,GDB can be said to have two sides to it:
1. The "symbol side" is concerned with symbolic information about the program.
Symbolic information includes function and variable names and types, line
numbers, machine register usage, and so on. The symbol side extracts symbolic
information from the program's executable file, parses expressions, finds the memory
address of a given line number, lists source code, and in general works with the
program as the programmer wrote it.
2. The "target side" is concerned with the manipulation of the target system. It
has facilities to strat and stop the program, to read memory and registers, to modify
them, to catch signals, and so on. The specifics of how this is done can vary drastically
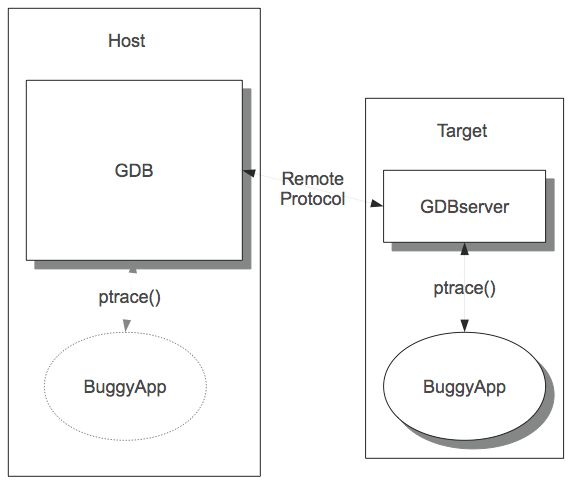
between systems; most unix-type systems provide a special system call named ptrace that
gives one process the ability to read and write the state of a different process. Thus, GDS's
target side is mostly about making ptrace calls and interpreting the results. For cross-debugging
an embedded system, however, the target side constructs message packets to send over a wire,
and wais for response packets in return.
2. examples of operation
To display source code and its compiled version, GDB does a combination of
reads from the source file and the target system, then uses compiler-generated
line number information to connect the two. In the example here, line 232 has the address
0x4004be, line 233 is at 0x4004ce, and so on.
[...]

232  result = positive_variable * arg1 + arg2;

0x4004be <+10>:  mov  0x200b64(%rip),%eax  # 0x601028 <positive_variable>

0x4004c4 <+16>:  imul -0x14(%rbp),%eax

0x4004c8 <+20>:  add  -0x18(%rbp),%eax

0x4004cb <+23>:  mov  %eax,-0x4(%rbp)


233  return result;

0x4004ce <+26>:  mov  -0x4(%rbp),%eax

[...]
The single-stepping command step conceals a complicated dance going on
behind the scenes. When the user asks to step to the next line in the program, the
target side is asked to execute only a single instruction of the program and then
stop it again(this is one of the things that ptrace can do). Upon being informed
that the program has stopped, GDB asks for the program counter(PC) register
(another target side operation) and then compares it with the range of addresses
that the symobl side says is associated with the current line. If the PC is outside
that range, then GDB leaves the program stopped, figures out the new source line,
and resports that to the user. If the PC is still in the range of the current line, then
GDB steps by another instruction and check again, repeating until the PC get to
a different line. This basic algorithm has the advantage that it always does the
right thing, whether the line has jumps, subroutine calls, etc., and does not require
GDB to interpret all the details of the machine's instruction set. A disadvantage is
that there are many interactions with the target for each single-step which, for
some embedded targets, results in noticeably slow stepping.
3. protobility
As a program needing extensive access all the way down to the physical registers
on a chip, GDB was designed from the beginning to be protable across a variety of
systems. However, its protability strategy has changed considerably over the years.
Orignally, GDS started out similar to the other GNU programs of the time; coded
in a minimal common subset of C, and using a combination of preprocessor
macros and Makefile fragments to adapt to a specific architecture and operating
system.
GDB's protability bits came to be separated into three classes, each with its own Makefile
frament and header file.
a. "Host" definitions are for the machine that GDB itself runs on, and might
include things like the sizes of the host's integer types. Originally done as
human-written header files.
b. "Target" definitions are specific to the machine running the program being
debugged. If the target is the same as the host, then we are doing native
debugging, otherwise it is "cross" debugging, using some kind of wire connecting
the two systems. Target definitions fall in turin into two main
classes:
c. "Architecture" definitions: These define how to disassemble machine code,
how to walk through the call stack, and which trap instruction to insert at breakpoints.
Originally done with macros, they were migrated to regular C accessed by via gdbarch
objects, described in more depth below.
d. Native definitions: These define the specifics of arguments to ptrace( which vary
considerably between flavors of Unix), how to find shared liararies that have been loaded,
and so forth, which only apply to the native debugging cases. Native definitions are a last
holdout of 1980s-style macros, although most are now figured out using autoconf.
4. Date structures
a. Breakpoints
b. Symbols and Symbol Tables
c. Stack frames
d. expressions
e. values
5. The symbol side
The symbol side of GDB is mainly responsible for reading the executable file,
extracting any symbolic information it finds, and building it into a symbol table.
The reading process starts with the BFD library. BFD is a sort of universal library
for handing binary and object files; running on any host, it can read and write the
original unix a.out format, COFF(used on System V unix and MS Windows),
ELF(modern Unix, GNU/linux, and most embedded systems), and some other file
formats. Internally, the library has a complicated structure of C macros that expand
into code incorporating the archne details of object file formats for dozens of
different systems. Introduced in 1990, BFD is also used by the GNU assembler and linker,
and its ability to produce objet files for any target is key to cross-development using
GNU tools.(porting BFD is also a key step in porting the tools to a new target).
GDB only uses BFD to read files, using ti to pull blocks of data from the executable
file into GDB's memory. GDB then has two levels of reader functions of its own.
The first level if for basic symbols, or "minimal symbols", which are just the names
that the linker needs to do its work. These are strings with addresses and not
much else; we assume that adresses in text sections are functions, addresses in data
sections are data, and so forth.
The second level is detailed symbolic information, which typically has its own
format different from the basic executable file format; for instance, information in
the DWARF debug format is contained in specially named sections of an ELF file.
By contrast, the old stabs debug format of Berkeley Unix used specially flagged
symbols stored in the general symbol table.
Partial symbol tables
Most of the symbolic information will never be looked at in a session, since it is
local to functions that the user may never examine. So, when GDB first pulls in a
program's symbols, it does a cursory scan through the symbolic infortion,
looking for just the globally visible symbols and recording only them in the symbol
table. Complete symbolic info for a function or method is filled in only if the user
stops inside it.
6. Target side
The target side is all about manipulation of program execution and raw data. In a
sense, the target side is a complete low-level debugger; if you are content to step
by instructions and dump raw memory, you can use GDB without needing any
symbols at all. (you may end up operating in this mode anyway, if the program
happens to stop in a library whose symbols have been stripped out.)
Target vectors and the target stack
Execution Control
The heart of GDB is its execution control loop. We touched on it earlier when describing
signle-stepping over a line; the algorithm entailed looping over multiple
instructions until finding one associated with a different source line. The loop is
called wait_for_inferior, or "WFI" for short.
GDBserver

GDBserver doesn't do anything that native GDB can't do; if your target system can run GDBserver, then theoretically it can run GDB. However, GDBserver is 10 times smaller and doesn't need to manage symbol tables, so it is very convenient for embedded GNU/Linux usages and the like.
7. Interfaces to GDB
Command-line Interface
The command-line interfaces uses the standard GNU library readline to handle
the character-by-character interaction with the user. Readline takes care of things
like line editing and command completion; the user can do things like use cursor
keys to go back in a line and fix a character.
Machine interface
One way to provide a debugging GUI is to use GDB as sort of backend to a
graphical interface program, translating mouse clicks into commands and
formatting print results into window. This ahs been made to work several times,
including KDbg and DDD(Data Display Debugger), bug it's not the ideal approach
because sometimes results are formated for human readability, omitting details
and relying on human ability to supply conext.
(gdb) step


buggy_function (arg1=45, arg2=92) at ex.c:232

232  result = positive_variable * arg1 + arg2;
With the MI, the input and output are more verbose, but easier for other software to parse accurately:
4321-exec-step


4321^done,reason="end-stepping-range",

      frame={addr="0x00000000004004be",

             func="buggy_function",

             args=[{name="arg1",value="45"},

                   {name="arg2",value="92"}],

             file="ex.c",

             fullname="/home/sshebs/ex.c",

             line="232"}
8. Development process
Testing testing
The test suite consists of a number of test programs combined with expect
scripts, using a tcl-based testing framework called DejaGNU. At the end of 2011,
the test suite includes some 18,000 test cases, which include
tests of basic functionality, language-specific tests, architecture-specific tests, and
MI tests. Most of these are generic and are run for any configuration. GDB
contributors are expected to run the test suite on patched sources and observe no
regressions, and new tests are expected to accompany each new feature.
9. lessons learned
Make a plan, but expect it to change
Things would be great if we were infinitely intelligent
After seeing some of the changes we made, you might be thinking: Why didn't we
do things right in the first place? Well, we just weren't smart enough.
The real lesson though is that not that GDBers were dumb, but that we couldn't
possibly have been smart enough to anticipate how GDB would need to evolve. In
1986 it was not at all clear that windows-and-mouse interface was going to
become ubiquitous; if the first version of GDB was perfectly adapted for GUI use,
we'd have looked like geniuses, but it would have been sheer luck. Instead, by
making GDB useful in a more limited scope, we built a user base that enabled more
extensive development adn re-engineering later.
Learn to live with Incomplete Transitions
Don't get too attached to the code
When we spend a long time with a single body of code, and it's an important
program that also pays the bills, it's easy to get attached to it, and even to mold
your thinking to fit the code, rather than the other way around.
Don't.
Everything in the code originated with a series of conscious decisions: some inspired,
some less so.
10. original url
http://www.aosabook.org/en/gdb.html