课前准备---多样本ATAC联合分析(封装版)
作者,Evil Genius
大家好,我们的课程已经在进行中了,需要分享给大家很多的分析资料,大家好好学习,资料很珍贵,好好保存。
ATAC的主流分析内容
1)Read filtering and alignment
2)Barcode counting
3)Identification of transposase cut sites
4)Detection of accessible chromatin peaks
5)Cell calling
6)Count matrix generation for peaks and transcription factors
7)Dimensionality reduction
8)Cell clustering
9)Cluster differential accessibility
ATAC分为了三部分,ATAC单独整合分析、ATAC联合RNA分析,多组学(ATAC + RNA)分析。本次分享第一部分。
ATAC的多样本联合分析包括,基础分析、去除双细胞、批次矫正、降维聚类、活性矩阵、peak的检测富集、差异region区域、motif的富集分析。
首先准备config文件,有多少个样本写多少样本,直接进行全流程分析
![]()
封装类脚本如下
#!bin/python
####zhaoyunfei
####20240627
####https://kzhang.org/SnapATAC2/tutorials/integration.html
####taskset -c 26 python
import snapatac2 as snap
import anndata as ad
import argparse
import pandas as pd
import matplotlib.pyplot as plt
import scanpy as sc
parse=argparse.ArgumentParser(description='SnapATAC2')
parse.add_argument('--fragmentlist',help='the fragmentlist of fragment file name,loomfile eg:fragment,samplename',type=str,required = True)
parse.add_argument('--outdir',help='the analysis dir',type=str)
parse.add_argument('--species',help='human or mouse',type=str,default = 'human')
argv = parse.parse_args()
fragmentlist = argv.fragmentlist
outdir = argv.outdir
species = argv.species
sample = pd.read_csv(fragmentlist,sep = ',')
if species == 'human':
adatas = snap.pp.import_data(list(sample['file']),file=[name + '.h5ad' for name in list(sample['sample'])],chrom_sizes=snap.genome.hg38,min_num_fragments=1000,sorted_by_barcode=False)
snap.metrics.tsse(adatas, snap.genome.hg38)
else:
adatas = snap.pp.import_data(list(sample['file']),file=[name + '.h5ad' for name in list(sample['sample'])],chrom_sizes=snap.genome.mm10,min_num_fragments=1000,sorted_by_barcode=False)
snap.metrics.tsse(adatas, snap.genome.mm10)
snap.pp.filter_cells(adatas, min_tsse=7)
snap.pp.add_tile_matrix(adatas, bin_size=5000)
snap.pp.select_features(adatas, n_features=50000)
snap.pp.scrublet(adatas)
snap.pp.filter_doublets(adatas)
####Creating AnnDataSet object
data = snap.AnnDataSet(adatas=[(name, adata) for (name, _), adata in zip(files, adatas)],filename="combined.h5ads")
unique_cell_ids = [sa + ':' + bc for sa, bc in zip(data.obs['sample'], data.obs_names)]
data.obs_names = unique_cell_ids
assert data.n_obs == np.unique(data.obs_names).size
snap.pp.select_features(data, n_features=50000)
snap.tl.spectral(data)
####Batch correction
snap.pp.harmony(data, batch="sample", max_iter_harmony=20)
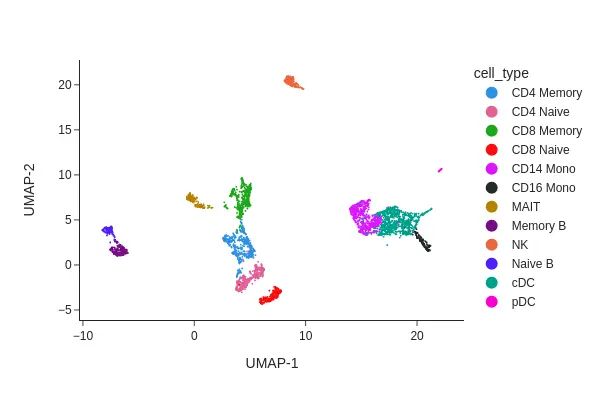
snap.tl.umap(data, use_rep="X_spectral_harmony")
snap.pl.umap(data, color="sample", interactive=False)
plt.savefig(outdir + '/combined.atac.umap.sample.png' ,dpi = 300,bbox_inches='tight')
####Clustering
snap.pp.knn(data, use_rep="X_spectral_harmony")
snap.tl.leiden(data)
snap.pl.umap(data, color="leiden", interactive=False)
plt.savefig(outdir + '/combined.atac.umap.leiden.png' ,dpi = 300,bbox_inches='tight')
###Cell cluster annotation
if species == 'human':
gene_matrix = snap.pp.make_gene_matrix(data, snap.genome.hg38)
else :
gene_matrix = snap.pp.make_gene_matrix(data, snap.genome.mm10)
####Imputation
sc.pp.filter_genes(gene_matrix, min_cells= 5)
sc.pp.normalize_total(gene_matrix)
sc.pp.log1p(gene_matrix)
gene_matrix.obsm["X_umap"] = data.obsm["X_umap"]
####Peak calling
snap.tl.macs3(data, groupby='leiden', replicate='sample')
if species == 'human':
merged_peaks = snap.tl.merge_peaks(data.uns['macs3'], chrom_sizes=snap.genome.hg38)
else :
merged_peaks = snap.tl.merge_peaks(data.uns['macs3'], chrom_sizes=snap.genome.mm10)
peaks.to_csv(outdir + '/combined.peak.xls',sep = '\t')
peak_mat = snap.pp.make_peak_matrix(data, use_rep=peaks['Peaks'])
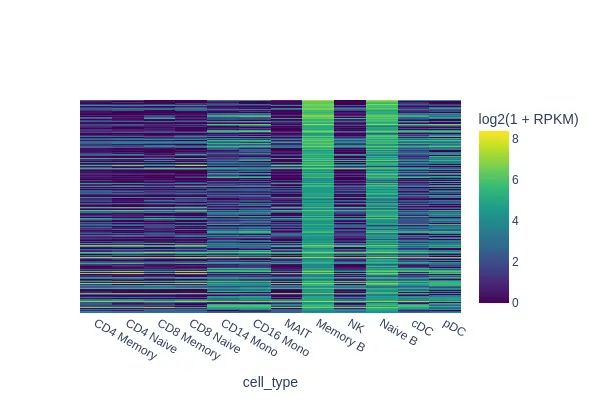
####Finding marker regions
marker_peaks = snap.tl.marker_regions(peak_mat, groupby='leiden', pvalue=0.01)
snap.pl.regions(peak_mat, groupby='leiden', peaks=marker_peaks, interactive=False)
plt.savefig(outdir + '/combined.atac.region.png' ,dpi = 300,bbox_inches='tight')
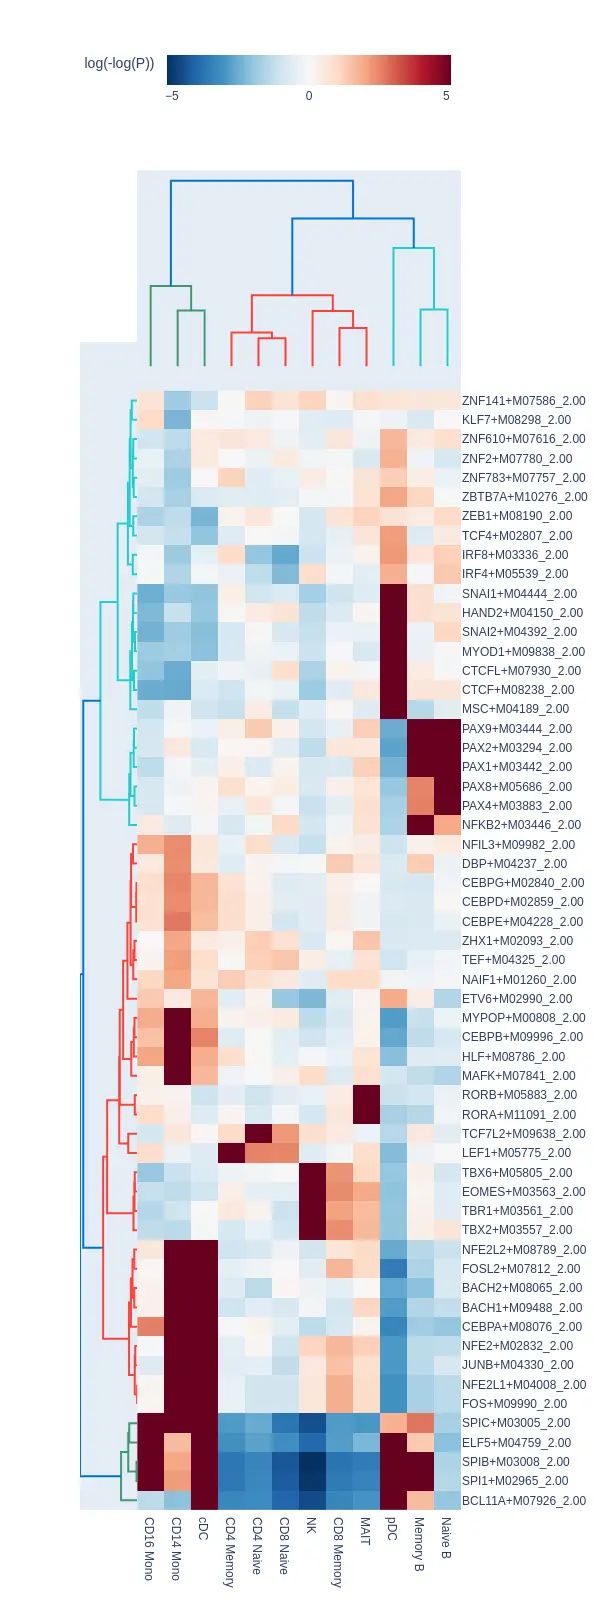
####motifs
if species == 'human':
motifs = snap.tl.motif_enrichment(motifs=snap.datasets.cis_bp(unique=True),regions=marker_peaks,genome_fasta=snap.genome.hg38)
else :
motifs = snap.tl.motif_enrichment(motifs=snap.datasets.cis_bp(unique=True),regions=marker_peaks,genome_fasta=snap.genome.mm10)
snap.pl.motif_enrichment(motifs, max_fdr=0.0001, height=1600, interactive=False)
plt.savefig(outdir + '/combined.atac.motif.png' ,dpi = 300,bbox_inches='tight')