MATLAB绘制人口金字塔
先看图
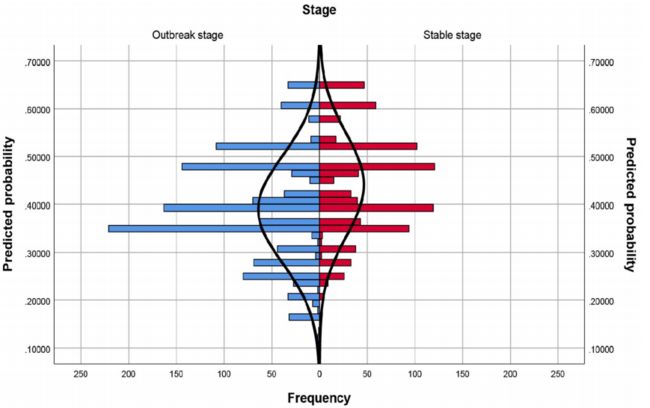
参考论文:< Perceived a community with shared future for doctor-patient and benefit finding: a moderated mediation model>
考虑到这并不是常见的人口金字塔(纵轴并不是表示年龄,而是概率),所以在随机构造数据的时候,主观进行了修改,话不多说,上代码
% 示例数据:10 年龄段男女口数(单位:万)
ageLabels = {'1', '23', '4', '0-9','10-19','20-29','30-39','40-49','50-59','60-69','70-79','80-89','90+', '2', '1', '3'};
malePop   = [120, 140, 135, 130, 115, 100,  80,  60,  30,  10];   % 男性
femalePop = [115, 135, 140, 125, 120, 105,  85,  70,  40,  15];   % 女性
malePop = [0,0 ,0, unifrnd(10, 100, [1, 10]), 0 ,0 ,0];
femalePop = [0,0 ,0, unifrnd(10, 100, [1, 10]), 0 ,0 ,0];
% 把男性数据取负,用于左侧绘图
malePlot = -malePop;

% 绘制水平柱状图
figure('Color','w');
hold on;
hBarM = barh(1:length(ageLabels), malePlot, 'BarWidth', 0.8, 'FaceColor',[0.4 0.6 1]);
hBarF = barh(1:length(ageLabels), femalePop, 'BarWidth', 0.8, 'FaceColor',[1 0.5 0.5]);

% 坐标和美化
yticks(1:length(ageLabels));
yticklabels(ageLabels);
xlabel('人口(万)');
title('人口金字塔及趋势拟合');
legend([hBarM, hBarF], {'男性','女性'}, 'Location','southoutside','Orientation','horizontal');
grid on;

% 画趋势拟合曲线 —— 这里用样条平滑(csaps)示例
x_age = 1:length(ageLabels);    % 数值化的“年龄索引”

% 样条平滑参数 p ∈ [0,1],数值越小越平滑
p = 0.5;
spM = csaps(x_age, malePlot, p);    % 男性
spF = csaps(x_age, femalePop, p);   % 女性

xx = linspace(1, length(ageLabels), 200);
yyM = fnval(spM, xx);
yyM(find(yyM > 0)) = 0;
a = find(yyM ~= 0, 1);
b = max(find(yyM ~= 0));
yyM(b + 2: end) = [];
yyM(1: a - 2) = [];
pp = xx(a - 1: b + 1);

yyF = fnval(spF, xx);
yyF(find(yyF < 0)) = 0;
m = find(yyF ~= 0, 1);
n = max(find(yyF ~= 0));
yyF(n + 2: end) = [];
yyF(1: m - 2) = [];
qq = xx(m - 1: n + 1);
% 绘制平滑曲线
plot(yyM, pp, '-','LineWidth',2, 'Color',[0 0.2 0.7]);
plot(yyF, qq, '-','LineWidth',2, 'Color',[0.7 0 0]);

% 调整 x 轴为对称范围
maxPop = max([malePop, femalePop]);
xlim([-maxPop*1.2, maxPop*1.2]);

% 在两侧添加正数标签
xticks(-maxPop:20:maxPop);
xticklabels(arrayfun(@(x) num2str(abs(x)), xticks, 'UniformOutput',false));

hold off;
看效果
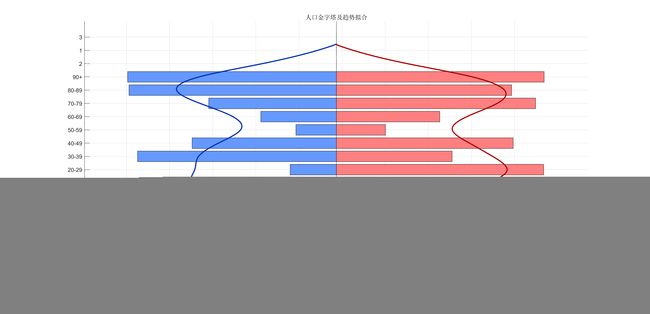 可以根据需要进行调整,Over!