zedGraph画心电图
 使用ZedGraph制作动态更新的统计图
因为项目要做一个曲线折图,就到网上找了找,发现ZedGraph这个开源的控件,看了下,发现还不错,但这个是外国佬写的,说明什么的是全英文,但还是很好懂 的,又发现一篇关于这个控件的中文文章,转过来收藏学习了。
本文转自:http://www.cnblogs.com/dahuzizyd/articles/621494.html
ZedGraph是很好的.net下的统计图开源项目,在以前的一篇随笔中提到,与其他的一些统计图控件相比,ZedGraph由于是直接在画布上作画,而不是生成图片显示,所以性能比较好,在诸如股市的实时走势图,显示cpu使用率等实时性较强的应用中有很好的表现,方法并不难,但是由于很少有人写这方面的文章,又正巧在其他论坛中看到有这方面的问题,所以写了下面的例子。
ZedGraph在描画折线图的时候,将所有的坐标点都保存在PointPairList中,在画线的时候以这个为X,Y坐标。要作动态的折线图,实际上就是不断在这个PointPairList中添加点坐标,然后刷新就可以了。
代码很简单:
Random ran = new Random();
PointPairList list = new PointPairList();
LineItem myCurve ;
Random用来生成示例数据,也就是Y坐标,PointPairList用来存放点集合。myCarve就是要画的线了。当然,不能忘了在窗体上添加zedGraph的控件。
为了突出效果,我们在Form的Load事件中加上下面的代码:
this.zedGraphControl1.GraphPane.Title.Text = "动态折线图";
this.zedGraphControl1.GraphPane.XAxis.Title.Text = "时间";
this.zedGraphControl1.GraphPane.YAxis.Title.Text = "数量";
this.zedGraphControl1.GraphPane.XAxis.Type = ZedGraph.AxisType.DateAsOrdinal;
for (int i = 0; i <= 100; i++)
{
double x = (double)new XDate(DateTime.Now.AddSeconds(-(100 - i)));
double y = ran.NextDouble();
list.Add(x, y);
}
DateTime dt = DateTime.Now;
myCurve = zedGraphControl1.GraphPane.AddCurve("My Curve",
list, Color.DarkGreen, SymbolType.None);
this.zedGraphControl1.AxisChange();
this.zedGraphControl1.Refresh();
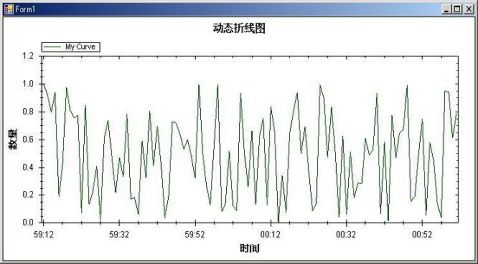
这样,窗体加载后就可以看到已经画出了一条折线图。可能象下面的样子:
但是现在,这条线现在还不会动,为了让它动起来就要定时给PointPairList中添加坐标。
添加一个Timer控件,设置Interval属性为1000,Enable 设置ture,不然的话,它是静态的。 然后在Timer的Tick事件中添加代码:
zedGraphControl1.GraphPane.XAxis.Scale.MaxAuto = true;
double x = (double)new XDate(DateTime.Now);
double y = ran.NextDouble();
list.Add(x, y);
this.zedGraphControl1.AxisChange();
this.zedGraphControl1.Refresh();
运行,就会看到线条动起来了。
如果要在折线图内显示指定数量的点,只需要在添加坐标之前把第一个坐标点去掉:
if (list.Count >= 100)
{
list.RemoveAt(0);
}
如果要象windows任务管理器中的cpu使用率那样,刚开始的时候是空的,随着时间的推移才逐渐画满,可以在初始化的时候填几个Y坐标为0的点:
for (int i = 0; i <= 100; i++)
{
double x = (double)new XDate(DateTime.Now.AddSeconds(-(100 - i)));
double y = 0;
list.Add(x, y);
}

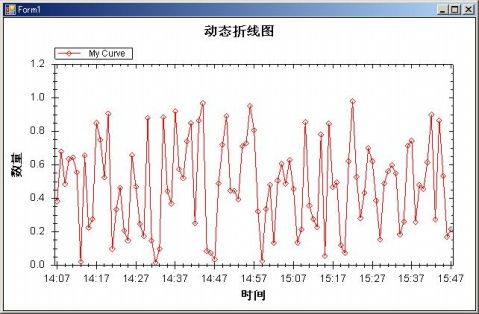
实际上,代码是比较简单的,关键就在于性能,在上面的代码中,在生成折线的时候使用的是SymbolType.None,如果使用其他几种,折点可以表示为方型,星形等图形,性能就要下降很多,例如,按照上面的代码,在我windows2000 专业版,赛扬1.7G,512内存的条件下,可以显示10000个点,而且没有明显的停顿现象,但是如果将折点的图形设置为SymbolType.Diamond,例如下图这样:
在10000个点的情况下停顿现象非常严重,实际上,不到2000个点就已经有明显的感觉了。同时在描线的时候没有使用抗锯齿,一样可以提高性能,不过,对性能的提升还是很有限的。如果以股市实时走势图为例,每天4个小时,如果每10秒更新一次,6×60×4=1440,可以看出ZedGraph完全可以适用。
      /*

      ****************************************************************
 *
 * 文件名:Form1;
 * 中文标识:画动态统计图;
 * 文件功能秒速:使用第三方控件zedgraph实现动态统计图;
 * 创建标识:ht20110405;
 * 日期:2011-04-05,星期二;
 * 编者:hetao;
 *
 * 修改标识:
 * 修改内容:
 * 修改日期:
 *
 ****************************************************************

      */


      using

       System;


      using

       System.Collections.Generic;


      using

       System.ComponentModel;


      using

       System.Data;


      using

       System.Drawing;


      using

       System.Text;


      using

       System.Windows.Forms;


      using

       ZedGraph;


      namespace

       zedGraphTwo
{


      public


      partial


      class

       Form1 : Form
 {


      public

       Form1()
 {
 InitializeComponent();
 }
 Random ran

      =


      new

       Random();

 PointPairList list

      =


      new

       PointPairList();

 LineItem myCurve;


      private


      void

       Form1_Load(

      object

       sender, EventArgs e)
 {


      this

      .zedGraphControl1.GraphPane.Title.Text

      =


      "

      动态折线图

      "

      ;


      this

      .zedGraphControl1.GraphPane.XAxis.Title.Text

      =


      "

      时间

      "

      ;


      this

      .zedGraphControl1.GraphPane.YAxis.Title.Text

      =


      "

      数量

      "

      ;


      this

      .zedGraphControl1.GraphPane.XAxis.Type

      =

       ZedGraph.AxisType.DateAsOrdinal;


      for

       (

      int

       i

      =


      0

      ; i

      <=


      100

      ; i

      ++

      )
 {


      double

       x

      =

       (

      double

      )

      new

       XDate(DateTime.Now.AddSeconds(

      -

      (

      100


      -

       i)));


      double

       y

      =

       ran.NextDouble();

 list.Add(x, y);

 }

 DateTime dt

      =

       DateTime.Now;


 myCurve

      =

       zedGraphControl1.GraphPane.AddCurve(

      "

      My Curve

      "

      ,

 list, Color.DarkGreen, SymbolType.None);


      this

      .zedGraphControl1.AxisChange();


      this

      .zedGraphControl1.Refresh();


 }


      private


      void

       timer1_Tick(

      object

       sender, EventArgs e)
 {
 zedGraphControl1.GraphPane.XAxis.Scale.MaxAuto

      =


      true

      ;


      double

       x

      =

       (

      double

      )

      new

       XDate(DateTime.Now);


      double

       y

      =

       ran.NextDouble();

 list.Add(x, y);


      this

      .zedGraphControl1.AxisChange();


      this

      .zedGraphControl1.Refresh();

 }
 }
}