Ubuntu Logstash Server with Kibana3 autoinstall
First off I will be keeping this script updated and available on Github located here. This will be the only location that I will be keeping up with it.
I would recommend using a clean install of Ubuntu 12.04 or 14.04 to install onto. However; if you decide to install on an existing server I am not responsible for anything that may get broken.
So here is how we get started and get everything up and running. Open up a terminal session on your server that you will be installing to and run the following commands.
For Logstash 1.4.x version: (CURRENT)
sudo apt-get update
sudo apt-get -y install git
cd ~
git clone https://github.com/mrlesmithjr/Logstash_Kibana3
chmod +x ./Logstash_Kibana3/install_logstash_1.4_kibana_ubuntu.sh
sudo ./Logstash_Kibana3/install_logstash_1.4_kibana_ubuntu.sh
You will be prompted during the script to enter your domain name, vSphere naming convention and PFSense Firewall hostname. These will be used to configure logstash filtering for your ESXi hosts and PFSense Firewall. If you do not monitor any vSphere hosts or use PFSense just enter some random info into these. These are purely just collecting info to pass into a filtering rule for Logstash.
Once complete open your browser of choice and connect to http://logstashservername/kibana or http://ipaddress/kibana.
You will see the following screen once connected. Seeing as we are setting up Logstash with Kibana go ahead and select the link on the left.

Now here is a screenshot of some actual ESXi logging. Notice the tag called VMware, that is created by the filtering rule that we created with the installer which, is based off of the naming convention we passed to the installer.
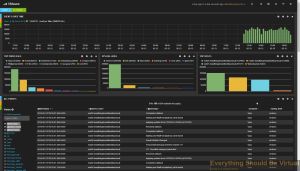
You can grab my VMware dashboard from here.
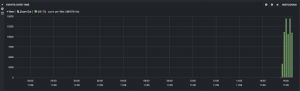
Here is another screenshot of logging graphs by adding different search criteria items.

So what we have done with this script is installed Apache2, Nginx, Elasticsearch, Logstash and Kibana3.
Now setup your network devices to start sending their syslogs to the HAProxy VIP and if your device supports sending via TCP, use it. Reference the port list below on setting up some of the devices that are pre-configured during the setup.
Port List
TCP/514 Syslog (Devices supporting TCP)
UDP/514 Syslog (Devices that do not support TCP)
TCP/1514 VMware ESXi
TCP/1515 VMware vCenter (Windows install or appliance) (For Windows install use NXLog from below in device setup) (For appliance reference device setup below)
TCP/3515 Windows Eventlog (Use NXLog from below in device setup)
TCP/3525 Windows IIS Logs (Use NXLog from below in device setup)
Below is a decent /etc/logstash/logstash.conf file that I am using and will be updating periodically. Some of these settings will be included in the install script but not all of them. You will need to change the naming for ESXi and PFSense for your environment. (Or just use the auto-install script).
For Windows Event Log’s I highly recommend using NXLog for Windows. I am including a fuctional nxlog.conf file for you to use as well with the above logstash.conf configuration.
Here is a screenshot of the Windows Logging if you want use the dashboard view for Windows from here.

(OLD)
That should be it.
Enjoy!
All comments and feedback are very much welcomed and encouraged.
Interested in a highly available setup? Go here and checkout the Highly Available ELK (Elasticsearch, Logstash and Kibana) setup.
文中相关划掉的内容未转载,若有相关的问题,可以参考原文.
转载自:http://everythingshouldbevirtual.com/ubuntu-logstash-server-kibana3-front-end-autoinstall