R语言 方差分析
一、单因素方差分析
方差分析要研究一种或多种因素的变化对实验结果是否有影响。因素的不同状态称为水平。其实要是只有两个水平,我们用t检验就可以检验出两组数据是否不一样。但水平比较多就需要做方差分析。
原假设H0:mu1 = mu2 = mu3 =……,即均值都相等, H1 ,各水平的均值不都相等
这个假设等同与,H0,各水平对指标的效应 a1 = a2 = a3……,H1 各个a不都相等。 在原假设成立的条件下,总离差平方和应该等于,各个水平内的离差平方和(随机误差)+各水平下均值和总体均值离差平方和,即St = Se + Sa,可以得到Se和Sa的无偏估计,两个无偏估计的比(Sa/(r-1))/(Se/(n-r))服从F(r-1,n-r)分布。然后就可以检验了。
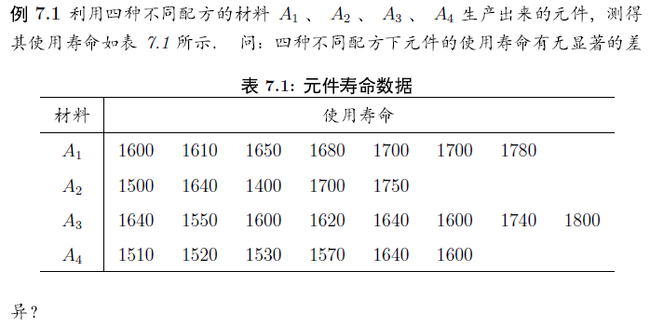
> x <- c(1600,1610,1650,1680,1700,1700,1780,1500,1640,
+ 1400,1700,1750,1640,1550,1600,1620,1640,1600,
+ 1740,1800,1510,1520,1530,1570,1640,1600)              #输入x
> a <- factor(c(rep(1,7),rep(2,5),rep(3,8),rep(4,6)))   #输入因子
> lamp <- data.frame(x=x,a=a)                          #弄成数据框
> plot(x~a,data=lamp)                             #画个箱线图看看
> lamp.aov <- aov(x ~a, data=lamp)                #做方差分析
> summary(lamp.aov)
            Df Sum Sq Mean Sq F value Pr(>F)
a            3  49212   16404   2.166  0.121   #p>0.05 不能拒绝原假设,认为材料对寿命没什么影响
Residuals   22 166622    7574                   #这一行是残差
例:小白鼠被打了细菌,下面是其存活天数,请问平均存活天数有没有明显差异?
> mouse <- data.frame(
+ x=c(2,4,3,2,4,7,7,2,2,5,4,5,6,8,5,10,7,
+ 12,12,6,6,7,11,6,6,7,9,5,5,10,6,3,10),
+ a=factor(c(rep(1,11),rep(2,10),rep(3,12))))
> mouse.aov <- aov(x~a, data=mouse)
> summary(mouse.aov)
            Df Sum Sq Mean Sq F value Pr(>F)
a            2  94.26   47.13   8.484 0.0012 **  #显著的 ,认为有差异
Residuals   30 166.65    5.56
---
Signif. codes:  0 ‘***’ 0.001 ‘**’ 0.01 ‘*’ 0.05 ‘.’ 0.1 ‘ ’ 1
到底那些水平间是不一样的,可以做t检验,但比较麻烦,另外重复使用t检验会增大第一类错误出现的概率。为了克服这些缺点,提出了调整p值的方法。在r中有这个函数
p.adjust(p, method = p.adjust.methods, n = length(p))
p.adjust.methods
# c("holm", "hochberg", "hommel", "bonferroni",
"BH", "BY", "fdr", "none")
我们使用pairwise.t.test()来获得多重比较的p值。
> pairwise.t.test(mouse$x,mouse$a,p.adjust.method="none")  #这里不对p值进行修正 method=none

        Pairwise comparisons using t tests with pooled SD

data:  mouse$x and mouse$a

  1       2
2 0.00072 -         #可以看到1和2,1和3p值都小于0.05,拒绝了原假设。
3 0.00238 0.54576

P value adjustment method: none
> pairwise.t.test(mouse$x,mouse$a)     #这里没指定方法,默认使用holm 来调整p值

        Pairwise comparisons using t tests with pooled SD

data:  mouse$x and mouse$a

  1      2
2 0.0021 -       #使用了调整方法后p值增大了一点,更可靠
3 0.0048 0.5458

P value adjustment method: holm
二、单因素方差分析的 检验
做方差分析有三个假设,需要提前进行检验。1.每个处理效应和随机误差是可加的。2.正态独立性,检验误差应该是正态分布的。3.方差齐次性。水平间的方差应该相等。
正态性检验可以使用shapior.test()
> shapiro.test(mouse$x[mouse$a==1]) #比如对上面老鼠的第一种细菌实验数据做检验

        Shapiro-Wilk normality test

data:  mouse$x[mouse$a == 1]
W = 0.8464, p-value = 0.03828 # p<0.05 拒绝了,不是正态的,所以上面不应该直接做方差分析
方差齐次性常用bartlett检验。这个原假设H0: 各个水平是等方差的
> bartlett.test(x~a, data=lamp)

        Bartlett test of homogeneity of variances

data:  x by a
Bartlett's K-squared = 5.8056, df = 3, p-value = 0.1215

> bartlett.test(mouse$x, mouse$a)

        Bartlett test of homogeneity of variances

data:  mouse$x and mouse$a
Bartlett's K-squared = 1.2068, df = 2, p-value = 0.5469

> var.test(mouse$x[mouse$a == 1], mouse$x[mouse$a == 2])

        F test to compare two variances

data:  mouse$x[mouse$a == 1] and mouse$x[mouse$a == 2]
F = 0.4852, num df = 10, denom df = 9, p-value = 0.2753
alternative hypothesis: true ratio of variances is not equal to 1
95 percent confidence interval:
 0.1224096 1.8336103
sample estimates:
ratio of variances
         0.4852152

> var.test(mouse$x[mouse$a == 1], mouse$x[mouse$a == 3])

        F test to compare two variances

data:  mouse$x[mouse$a == 1] and mouse$x[mouse$a == 3]
F = 0.6039, num df = 10, denom df = 11, p-value = 0.4353
alternative hypothesis: true ratio of variances is not equal to 1
95 percent confidence interval:
 0.1712726 2.2130623
sample estimates:
ratio of variances
         0.6038511

> var.test(mouse$x[mouse$a == 2], mouse$x[mouse$a == 3])

        F test to compare two variances

data:  mouse$x[mouse$a == 2] and mouse$x[mouse$a == 3]
F = 1.2445, num df = 9, denom df = 11, p-value = 0.7204
alternative hypothesis: true ratio of variances is not equal to 1
95 percent confidence interval:
 0.3468608 4.8685825
sample estimates:
ratio of variances
          1.244501
三、Kruskal-Wdlis秩和检验
有时候我们的数据不符合方差检验的要求,可以使用Kruskal-Wdlis检验。
例:活捉25只老鼠,随机分成四组,分别喂不同的饲料,一段时间后,各只老鼠的体重增量如下: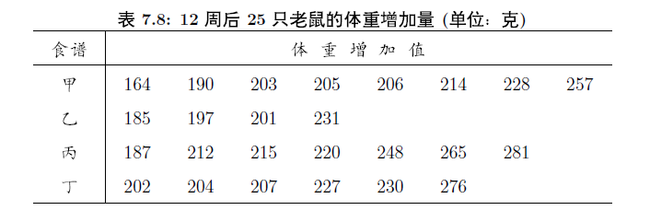
> food <- data.frame(
+ x=c(164,190,203,205,206,214,228,257,
+ 185,197,201,231,
+ 187,212,215,220,248,265,281,
+ 202,204,207,227,230,276),
+ g=factor(rep(1:4,c(8,4,7,6)))
+ )
> kruskal.test(x~g, data=food)

        Kruskal-Wallis rank sum test

data:  x by g
Kruskal-Wallis chi-squared = 4.213, df = 3, p-value = 0.2394 #认为无差异
#这个数据可以通过所有检验,所以也可以做aov()
四、FriedMan秩和检验
配伍组。这个概念不是很懂,大概是同一批对象在不同水平,同时测定,是配对设计的一种。对于这种实验设计,R语言中用friedman.test()来检验。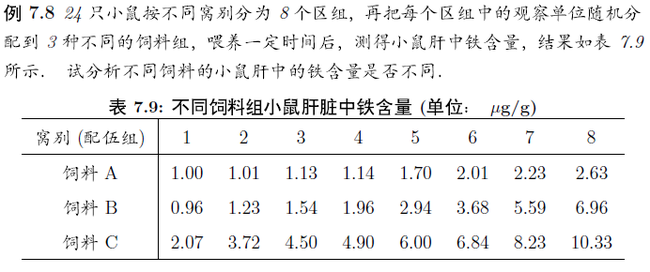
> data <- c(1,1.01,1.13,1.14,1.70,2.01,2.23,2.63,0.96,1.23,1.54,1.96,2.94,3.68,5.59,6.96,
+ 2.07,3.72,4.50,4.9,6,6.84,8.23,10.33)
> x <- matrix(data,ncol=3,dimnames=list(1:8,c("A","B","C")))
> friedman.test(x)

        Friedman rank sum test

data:  x
Friedman chi-squared = 14.25, df = 2, p-value = 0.0008047 #有差异。
五、双因素方差分析
上面讲的方差分析只有一个因素,如果有两个因素。如果有两个因素,那么假设也变成两个
不考虑因素A和因素B的交互作用 H01: a1 = a2 = a3 = …… H02: b1 = b2 = b3 ……, St = Se + Sa + Sb
考虑A和B的交互作用。 H01: a1=a2=…… H02: b1 = b2 =…… ,H03: ab1 = ab2 = ab3 ……,考虑交互作用的时候 St = Se + Sa + Sb + Sab.
#不考虑相互作用
> argriculture <- data.frame(
+ y=c(325,292,316,317,310,318,
+ 310,320,318,330,370,365),
+ A=gl(4,3),         #gl是产生因子的函数。 第一个参数表示4个因子,第二个参数表示每个重复3遍
+ B=gl(3,1,12))      #第一个参数表示3个因子,重复一遍,循环直到产生12个为止。
> argriculture.aov <- aov(y ~ A + B, data=argriculture)
> summary(argriculture.aov)
            Df Sum Sq Mean Sq F value Pr(>F)
A            3   3824  1274.8   5.226 0.0413 *
B            2    163    81.3   0.333 0.7291    #这里看出B对这个没什么影响。
Residuals    6   1463   243.9
---
Signif. codes:  0 ‘***’ 0.001 ‘**’ 0.01 ‘*’ 0.05 ‘.’ 0.1 ‘ ’ 1
例:为了研究树种和地理位置对松树成长的影响,对四个地区和三种树种的直径进行测量A表示树种,B表示地区。对每个水平都测量了5次。进行方差分析。
#考虑交互作用
> tree <- data.frame(
+ y=c(23,25,21,14,15,20,17,11,26,21,
+ 16,19,13,16,24,20,21,18,27,24,
+ 28,30,19,17,22,26,24,21,25,26,
+ 19,18,19,20,25,26,26,28,29,23,
+ 18,15,23,18,10,21,25,12,12,22,
+ 19,23,22,14,13,22,13,12,22,19),
+ a=gl(3,20,60),
+ b=gl(4,5,60))
> tree.aov <- aov(y ~ a + b + a:b, data=tree)
> summary(tree.aov)
            Df Sum Sq Mean Sq F value   Pr(>F)
a            2  352.5  176.27   8.959 0.000494 *** #只有树种是显著的额。
b            3   87.5   29.17   1.483 0.231077
a:b          6   71.7   11.96   0.608 0.722890
Residuals   48  944.4   19.68
---
Signif. codes:  0 ‘***’ 0.001 ‘**’ 0.01 ‘*’ 0.05 ‘.’ 0.1 ‘ ’ 1
对于双样本 我们还是要检查 正态性和方差齐次性。
#检查正态 其中有一组数据不是正态的 ,需要调整。
> shapiro.test(tree$y[tree$a==1])

        Shapiro-Wilk normality test

data:  tree$y[tree$a == 1]
W = 0.9759, p-value = 0.8703
#检查方差
> bartlett.test(tree$y~tree$a)

        Bartlett test of homogeneity of variances

data:  tree$y by tree$a
Bartlett's K-squared = 0.59, df = 2, p-value = 0.7445

> bartlett.test(tree$y~tree$b)

        Bartlett test of homogeneity of variances

data:  tree$y by tree$b
Bartlett's K-squared = 2.0436, df = 3, p-value = 0.5634
六、正交实验设计与方差分析
人们在长期的实践中发现,要得到理想的结果,并不需要进行全面试验,即使因素个数、水平都不太多,也不必做全面试验.尤其对那些试验费用很高,或是具有破坏性的试验,更不要做全面试验.我们应当在不影响试验效果的前提下,尽可能地减少试验次数。正交设计就是解决这个问题的有效方法。正交表设计详见百度文库:http://wenku.baidu.com/link?url=DFlQCWpvTWCH4Kufq1VqtPqAy8cvlrpuO4b74IVrecyefMqr-VKC8Zrx5ewTQZRH3Wujmcnf_dqkMa4zyPmX59gWSF2G_EqT2i-Eqs6-lPC
主要是在任意两列中,将同一行的两个数字看成有序数对时,每种数对出现的次数是相等的,这样就使每种水平和每种因素的搭配都是均衡的,可以用来做检测。
记个3因素,3水平的例子:
某种化学反应的转化率与温度A,反应时间B,用碱量C有关,每个因素有三种不同的水平如下:
如何设计正交实验并用r做分析:
> rate <- data.frame(
+ a=gl(3,3),
+ b=gl(3,1,9),
+ c=factor(c(1,2,3,2,3,1,3,1,2)),
+ y=c(31,54,38,53,49,42,57,62,64))
> rate.aov <- aov(y ~ a + b + c, data=rate)
> summary(rate.aov)
            Df Sum Sq Mean Sq F value Pr(>F)
a            2    618     309  34.333 0.0283 *
b            2    114      57   6.333 0.1364    #b 反应时间不显著。
c            2    234     117  13.000 0.0714 .
Residuals    2     18       9
---
Signif. codes:  0 ‘***’ 0.001 ‘**’ 0.01 ‘*’ 0.05 ‘.’ 0.1 ‘ ’ 1
画个图 看一看情况:
> rate.mean <- matrix(0,nrow=3,ncol=3,dimnames=list(1:3,c("A","B","C")))
> for(j in 1:3){for(i in 1:3){rate.mean[i,j] <- mean(rate$y[rate[j]==i])}}
> plot(as.vector(rate.mean),axes=F,xlab="Level",ylab="Rate")
> xmark <- c(NA,"a1","a2","a3","b1","b2","b3","c1","c2","c3",NA)
> axis(1,0:10,labels=xmark)
> axis(3,0:10,labels=xmark)
> axis(2,4*10:16)
> axis(4,4*10:16)
> lines(rate.mean[,"A"])
> lines(rate.mean[4:6,"B"])
> lines(rate.mean[7:9,"C"])
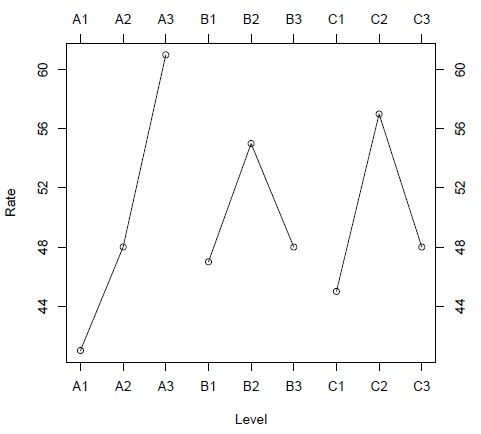
从结果来看 B反应时间影响不大,A温度 高点好,用碱量适中。 所以我们选择A3B1C2或者A3B2C2。但这个组合不在我们的正交实验设计里,需要在做实验验证。
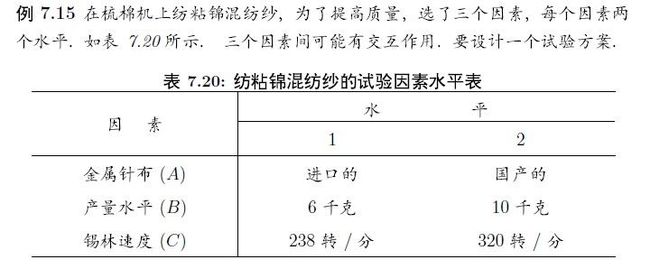
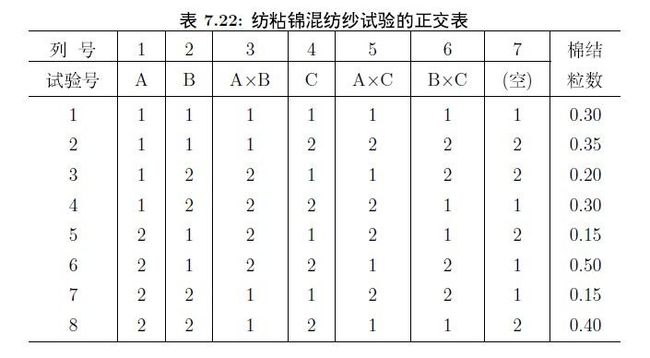
下面是有交互的例子:
> cotton <- data.frame(
+ y=c(0.30,0.35,0.20,0.30,0.15,0.50,0.15,0.40),
+ a=gl(2,4),
+ b=gl(2,2,8),
+ c=gl(2,1,8))
> cotton.aov <- aov(y~a+b+c+a:b+b:c+a:c, data=cotton)
> summary(cotton.aov)
            Df  Sum Sq Mean Sq F value Pr(>F)
a            1 0.00031 0.00031   0.111  0.795
b            1 0.00781 0.00781   2.778  0.344
c            1 0.07031 0.07031  25.000  0.126
a:b          1 0.00031 0.00031   0.111  0.795
b:c          1 0.00031 0.00031   0.111  0.795
a:c          1 0.02531 0.02531   9.000  0.205
Residuals    1 0.00281 0.00281
> cotton.aovnew <- aov(y~b+c+a:c, data=cotton) #因为都不显著,去掉几个p值太高的
> summary(cotton.aovnew)
            Df  Sum Sq Mean Sq F value  Pr(>F)
b            1 0.00781 0.00781   6.818 0.07960 .
c            1 0.07031 0.07031  61.364 0.00433 **
c:a          2 0.02562 0.01281  11.182 0.04068 *
Residuals    3 0.00344 0.00115
---
Signif. codes:  0 ‘***’ 0.001 ‘**’ 0.01 ‘*’ 0.05 ‘.’ 0.1 ‘ ’ 1
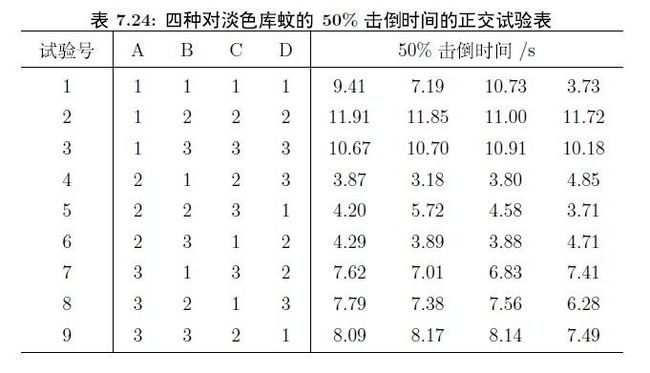
在一种情况下可能有多个测量值。仍然是按上面的方法做分析:
> mosquito <- data.frame(
+ a=gl(3,12),b=gl(3,4,36),
+ c=factor(rep(c(1,2,3,2,3,1,3,1,2),rep(4,9))),
+ d=factor(rep(c(1,2,3,3,1,2,2,3,1),rep(4,9))),
+ y=c(9.41,7.19,10.73,3.73,11.91,11.85,11.00,11.72,10.67,10.70,10.91,10.18,3.87,3.18,3.80,
+ 4.85,4.20,5.72,4.58,3.71,4.29,3.89,3.88,4.71,7.62,7.01,6.83,7.41,7.79,7.38,
+ 7.56,6.28,8.09,8.17,8.14,7.49))
> mosquito.aov <- aov(y~a+b+c+d, data=mosquito)
> summary(mosquito.aov)
            Df Sum Sq Mean Sq F value  Pr(>F)
a            2 201.31  100.65  77.488 6.5e-12 ***
b            2  15.92    7.96   6.128 0.00639 **
c            2  13.30    6.65   5.118 0.01304 *
d            2   5.02    2.51   1.933 0.16428
Residuals   27  35.07    1.30
---
Signif. codes:  0 ‘***’ 0.001 ‘**’ 0.01 ‘*’ 0.05 ‘.’ 0.1 ‘ ’ 1
分析出差别后利用平均值选择最优的水平
