使用ListBox控件来实现直方图控件(三)
洋洋洒洒几千言以后,在前一篇文章的最后终于看到一丝曙光了— 至少有一个看起来像直方图的玩意了。使用ItemsControl来实现直方图有以下几个优点:
1. 省去了手工布局X轴坐标上刻度的问题,否则的话,我们必须写类似下面的代码来布局X轴坐标的刻度。
double tickMarkWidth = LineChart.ActualWidth / CategoryTickMarks.Count;
double left = 0.0;
foreach (TickMark mark in CategoryTickMarks)
{
Canvas.SetLeft(mark, left);
// 顺序排列X坐标
left += tickMarkWidth;
}
2. 可以利用DataBinding的机制使用最少的代码来提供放大、缩小的功能。
3. 使用ItemsControl,可以通过替换显示坐标轴的坐标的DataTemplate来达到自定义的坐标轴效果。
因为前一篇文章里面的直方图是将数据硬编码在Xaml文件里面的,因此这一次我们要使用程序计算出各个矩形的高度,这个计算我们可以通过将前一篇文章DataTemplate里面的Rectangle的高度绑定到图表的数据上面,然后通过转换器(IConverter)来将数据转换成Rectangle的高度:
internal class ValueToRectangleHeightConverter : IValueConverter
{
#region IValueConverter Members
public object Convert(object value, Type targetType, object parameter, System.Globalization.CultureInfo culture)
{
// 获取传递过来的直方图控件实例的引用
ObjectDataProvider provider = parameter as ObjectDataProvider;
Histogram histogram = provider.ObjectInstance as Histogram;
Debug.Assert(histogram != null);
double number = (double)value;
// 加一个0.9是不想让直方图数据的最大值顶到了直方图的最上层。
return histogram.ActualHeight * 0.9 * number / (histogram.Maximum - histogram.Minimum);
}
public object ConvertBack(object value, Type targetType, object parameter, System.Globalization.CultureInfo culture)
{
throw new NotImplementedException();
}
#endregion
}
至于直方图刻度的宽度,可以使用一个变量来保存,因为我们需要给用户一个选择,他既可以让我们的直方图控件自动计算出一个合适的值,也可以设置自定义的值,当然,每次用户代码修改刻度的宽度,我们都希望自动将直方图重绘:
/// <summary>
/// 获取和设置直方图横坐标上每一个刻度的宽度。
/// </summary>
public double TickMarkWidth
{
get { return (double)GetValue(TickMarkWidthProperty); }
set { SetValue(TickMarkWidthProperty, value); }
}
public static readonly DependencyProperty TickMarkWidthProperty =
DependencyProperty.Register("TickMarkWidth", typeof(double), typeof(Histogram), new UIPropertyMetadata(0.0d));
我们希望直方图能够在可视区域显示所有的数据,所以需要知道直方图所表示的数据范围,然后在显示数据的时候按比例显示每一个矩形:
internal double Maximum = 0.0d;
internal double Minimum = 0.0d;
因为我们希望支持多种格式的数据,因此最好在直方图控件内部采用一种统一的格式,这样方便我们编程:
/// <summary>
/// 因为我们打算支持很多种不同的数据,例如数组,Dictionary以及其他的可以解释成
/// 键值对的数组,所以直方图内部最好有一个统一格式的数据结构来表示这些不同的数据。
/// 至于数据格式之间的转换问题,我们可以通过采用Adapter模式来做。
/// </summary>
internal class HistogramDataObject
{
public object Category { get; set; }
public double Value { get; set; }
}
在Xaml中,我们就可以通过重载ItemsControl的ItemsPanel和ItemTemplate属性来绘制一个直方图了:
<ItemsControl ItemsSource="{Binding}" Padding="0" Margin="0"
HorizontalContentAlignment="Stretch">
<ItemsControl.ItemsPanel>
<ItemsPanelTemplate>
<VirtualizingStackPanel HorizontalAlignment="Stretch" Orientation="Horizontal" IsItemsHost="True" />
</ItemsPanelTemplate>
</ItemsControl.ItemsPanel>
<ItemsControl.ItemTemplate>
<DataTemplate>
<!--
为了节省计算时间,我们在每次给直方图控件赋值的时候,计算出直方图控件的每一个刻度的宽度来。
-->
<Grid Margin="0" Width="{Binding ElementName=HistogramControl, Path=TickMarkWidth}">
<Grid.RowDefinitions>
<RowDefinition Height="*" />
<RowDefinition Height="25" />
</Grid.RowDefinitions>
<StackPanel Grid.Row="0" VerticalAlignment="Bottom">
<Rectangle Fill="Gray" ToolTip="{Binding Path=Value}">
<Rectangle.Height>
<Binding Path="Value"
Converter="{StaticResource valueToRectangleHeightConverter}"
ConverterParameter="{StaticResource histogramSelfInstance}" />
</Rectangle.Height>
</Rectangle>
</StackPanel>
<Label Margin="0" Padding="2 0 2 0" Grid.Row="1" BorderBrush="Gray" HorizontalContentAlignment="Center"
BorderThickness="0 0 1 0" Content="{Binding Path=Category}" Foreground="Gray" VerticalAlignment="Top" />
</Grid>
</DataTemplate>
</ItemsControl.ItemTemplate>
</ItemsControl>
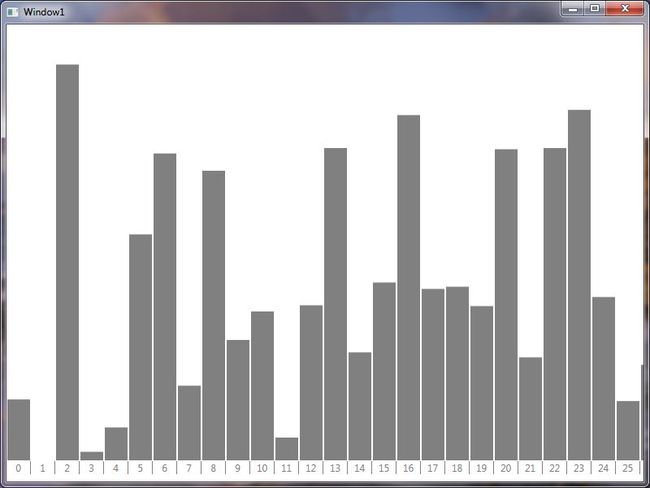
下面的就是效果截图:
Window1.xaml:
<Window x:Class="CodeLibrary.Charts.Window1"
xmlns="http://schemas.microsoft.com/winfx/2006/xaml/presentation"
xmlns:x="http://schemas.microsoft.com/winfx/2006/xaml"
xmlns:local="clr-namespace:CodeLibrary.Charts"
Loaded="Window_Loaded"
Unloaded="Window_Unloaded"
Title="Window1" Height="600" Width="800">
<local:Histogram x:Name="TestHistogram"/>
</Window>
Window1.xaml.cs:
using System;
using System.Collections.Generic;
using System.Linq;
using System.Text;
using System.Windows;
using System.Windows.Controls;
using System.Windows.Data;
using System.Windows.Documents;
using System.Windows.Input;
using System.Windows.Media;
using System.Windows.Media.Imaging;
using System.Windows.Navigation;
using System.Windows.Shapes;
using System.Diagnostics;
using System.ComponentModel;
namespace CodeLibrary.Charts
{
public partial class Window1 : Window
{
public Window1()
{
InitializeComponent();
}
private void Window_Loaded(object sender, RoutedEventArgs e)
{
double[] test = new double[256];
double[] test2 = new double[256];
double[] test3 = new double[256];
Random random = new Random(1000);
for (int i = 0; i < test.Length; ++i)
{
test[i] = random.Next();
test2[i] = random.Next();
test3[i] = random.Next();
}
TestHistogram.HistogramData = test;
TestHistogram.TickMarkWidth = 30;
}
}
}
Histogram.xaml:
<UserControl x:Class="CodeLibrary.Charts.Histogram"
xmlns="http://schemas.microsoft.com/winfx/2006/xaml/presentation"
xmlns:x="http://schemas.microsoft.com/winfx/2006/xaml"
xmlns:local="clr-namespace:CodeLibrary.Charts" x:Name="HistogramControl">
<UserControl.Resources>
<!--
这个Converter用来将直方图里面的数据转换成矩形的高度
-->
<local:ValueToRectangleHeightConverter x:Key="valueToRectangleHeightConverter" />
<!--
在计算直方图每一项矩形的高度的时候,需要得到当前Histogram控件的高度,以及它所表示的
值得范围,因此我们需要将当前的Histogram控件传递给ValueToRectangleHeightConverter。
可以通过ObjectDataProvider来做,然后在Histogram控件的构造函数里面将自身的引用保存下来
-->
<ObjectDataProvider x:Key="histogramSelfInstance" />
</UserControl.Resources>
<ItemsControl ItemsSource="{Binding}" Padding="0" Margin="0"
HorizontalContentAlignment="Stretch">
<ItemsControl.ItemsPanel>
<ItemsPanelTemplate>
<VirtualizingStackPanel HorizontalAlignment="Stretch" Orientation="Horizontal" IsItemsHost="True" />
</ItemsPanelTemplate>
</ItemsControl.ItemsPanel>
<ItemsControl.ItemTemplate>
<DataTemplate>
<!--
为了节省计算时间,我们在每次给直方图控件赋值的时候,计算出直方图控件的每一个刻度的宽度来。
-->
<Grid Margin="0" Width="{Binding ElementName=HistogramControl, Path=TickMarkWidth}">
<Grid.RowDefinitions>
<RowDefinition Height="*" />
<RowDefinition Height="25" />
</Grid.RowDefinitions>
<StackPanel Grid.Row="0" VerticalAlignment="Bottom">
<Rectangle Fill="Gray" ToolTip="{Binding Path=Value}" Stroke="White" StrokeThickness="1">
<Rectangle.Height>
<Binding Path="Value"
Converter="{StaticResource valueToRectangleHeightConverter}"
ConverterParameter="{StaticResource histogramSelfInstance}" />
</Rectangle.Height>
</Rectangle>
</StackPanel>
<Label Margin="0" Padding="2 0 2 0" Grid.Row="1" BorderBrush="Gray" HorizontalContentAlignment="Center"
BorderThickness="0 0 1 0" Content="{Binding Path=Category}" Foreground="Gray" VerticalAlignment="Top" />
</Grid>
</DataTemplate>
</ItemsControl.ItemTemplate>
</ItemsControl>
</UserControl>
Histogram.xaml.cs:
using System;
using System.Collections.Generic;
using System.Linq;
using System.Text;
using System.Windows;
using System.Windows.Controls;
using System.Windows.Data;
using System.Windows.Documents;
using System.Windows.Input;
using System.Windows.Media;
using System.Windows.Media.Imaging;
using System.Windows.Navigation;
using System.Windows.Shapes;
using System.Diagnostics;
using System.Collections;
using System.IO;
using System.Threading;
namespace CodeLibrary.Charts
{
public partial class Histogram : UserControl
{
public object HistogramData
{
get { return (object)GetValue(HistogramDataProperty); }
set { SetValue(HistogramDataProperty, value); }
}
public static readonly DependencyProperty HistogramDataProperty =
DependencyProperty.Register("HistogramData", typeof(object), typeof(Histogram), new UIPropertyMetadata(null, new PropertyChangedCallback(HistogramDataChanged)));
/// <summary>
/// 获取和设置直方图横坐标上每一个刻度的宽度。
/// </summary>
public double TickMarkWidth
{
get { return (double)GetValue(TickMarkWidthProperty); }
set { SetValue(TickMarkWidthProperty, value); }
}
public static readonly DependencyProperty TickMarkWidthProperty =
DependencyProperty.Register("TickMarkWidth", typeof(double), typeof(Histogram), new UIPropertyMetadata(0.0d));
/// <summary>
/// 获取和设置直方图中数据的最大值,因为我们希望在直方图的可视区域里面显示所有的矩形,
/// 获取数据的最大值和最小值之后,其他的值我们可以按照比例放置,这样就能显示直方图中所有的数据了。
///
/// 之所以设置成internal,是因为我们希望在同一个Assembly里面的Converter可以访问,但是不期望用户代码
/// 能够访问到他们--反射除外。
/// </summary>
internal double Maximum = 0.0d;
internal double Minimum = 0.0d;
/// <summary>
/// 因为我们打算支持很多种不同的数据,例如数组,Dictionary以及其他的可以解释成
/// 键值对的数组,所以直方图内部最好有一个统一格式的数据结构来表示这些不同的数据。
/// 至于数据格式之间的转换问题,我们可以通过采用Adapter模式来做。
/// </summary>
internal class HistogramDataObject
{
public object Category { get; set; }
public double Value { get; set; }
}
public Histogram()
{
InitializeComponent();
ObjectDataProvider provider = FindResource("histogramSelfInstance") as ObjectDataProvider;
provider.ObjectInstance = this;
}
private static void HistogramDataChanged(DependencyObject sender, DependencyPropertyChangedEventArgs e)
{
Histogram histogram = sender as Histogram;
Debug.Assert(histogram != null);
if (e.NewValue is Array)
PopulateArray(histogram, e);
else if (e.NewValue is IDictionary)
PopulateDictionary(histogram, e);
else
throw new NotImplementedException("Supports for objects other than Dictionary and Array are not implemented yet!");
}
private static void PopulateArray(Histogram histogram, DependencyPropertyChangedEventArgs e)
{
Array array = e.NewValue as Array;
Debug.Assert(array != null);
Trace.WriteLineIf(array.Rank > 1, "Warning, multiple dimentional array is treated as 1-D array");
List<HistogramDataObject> histogramDataObjects = new List<HistogramDataObject>();
int index = 0;
foreach (object a in array)
{
if (!(a is IConvertible))
throw new InvalidDataException("Only arrays which host IComparable object are supported");
histogramDataObjects.Add(new HistogramDataObject() { Category = index++, Value = ((IConvertible)a).ToDouble(Thread.CurrentThread.CurrentUICulture) });
}
// 重新计算直方图数据的范围
histogram.Maximum = histogramDataObjects.Max(h => h.Value);
histogram.Minimum = histogramDataObjects.Min(h => h.Value);
// 计算每一个刻度的宽度
double tickWidth = histogram.ActualWidth / (histogramDataObjects.Count + 1);
histogram.TickMarkWidth = tickWidth > 1 ? tickWidth : 1;
// 强制直方图更新视图
histogram.DataContext = histogramDataObjects;
}
private static void PopulateDictionary(Histogram histogram, DependencyPropertyChangedEventArgs e)
{
throw new NotImplementedException();
}
}
}
Converters.cs:
using System;
using System.Collections.Generic;
using System.Linq;
using System.Text;
using System.Windows.Data;
using System.Diagnostics;
using System.Windows.Controls;
using System.Windows;
using System.Windows.Media;
using System.Windows.Shapes;
namespace CodeLibrary.Charts
{
internal class ValueToRectangleHeightConverter : IValueConverter
{
#region IValueConverter Members
public object Convert(object value, Type targetType, object parameter, System.Globalization.CultureInfo culture)
{
// 获取传递过来的直方图控件实例的引用
ObjectDataProvider provider = parameter as ObjectDataProvider;
Histogram histogram = provider.ObjectInstance as Histogram;
Debug.Assert(histogram != null);
double number = (double)value;
// 加一个0.9是不想让直方图数据的最大值顶到了直方图的最上层。
return histogram.ActualHeight * 0.9 * number / (histogram.Maximum - histogram.Minimum);
}
public object ConvertBack(object value, Type targetType, object parameter, System.Globalization.CultureInfo culture)
{
throw new NotImplementedException();
}
#endregion
}
}
