<style type="text/css">
.biself {
width:100%;
height:auto;
float:left;
}
//注意样式继承的特性,即其子元素也会有容器设定的样式,如果子元素也有这样属性的话。当然,子元素再重新设置样式时,这个时候就是覆盖了。
.biself .imself{
height:auto;
line-height:46px;
font-size:18px;
overflow:hidden;
color:#fff;
text-shadow:1px 1px #000;
float:left;
}
th,td{
text-align:center;
color:#fff;
background-color:#6EC896
}
</style>
<script>
$(function () {
var chart;
$(document).ready(function () {
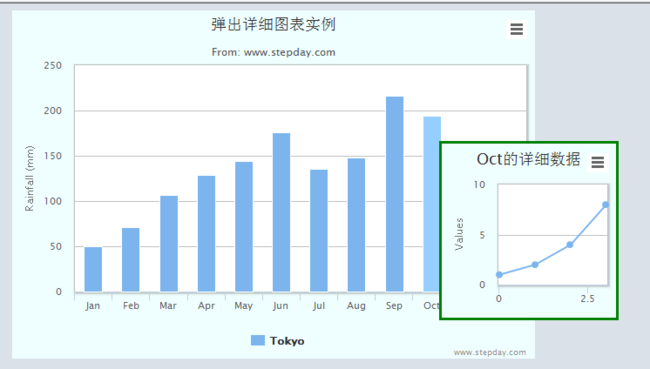
chart = new Highcharts.Chart({
chart: {
renderTo: 'container',
type: 'column'
},
title: {
text: '弹出详细图表实例'
},
subtitle: {
text: 'From: www.stepday.com'
},
xAxis: {
categories: [
'Jan',
'Feb',
'Mar',
'Apr',
'May',
'Jun',
'Jul',
'Aug',
'Sep',
'Oct',
'Nov',
'Dec'
]
},
yAxis: {
min: 0,
title: {
text: 'Rainfall (mm)'
}
},
tooltip: {
//通过格式化方法动态在指定位置创建图表层
formatter: function () {
return false;
}
},
plotOptions: {
series: {
point: {
events: {
//鼠标移动至某个柱子上时显示副图表
mouseOver: function () {
var x, y, width = 200, height = 200;
//获取当前鼠标的绝对位置值
x = event.clientX;
y = event.clientY;
var objectData = new Object();
objectData.title = this.category; //将当前柱子的X轴刻度值作为副图表的标题
//调用函数弹出副图表
DynamicCreateSubChart(objectData, width, height, x, y);
}
}
},
events: {
//鼠标移开柱子时的操作
mouseOut: function () {
//隐藏图表且回收资源
HiddenSubChart();
}
}
}
},
credits: {
text: "www.stepday.com",
href: "http://www.stepday.com"
},
series: [{
name: 'Tokyo',
data: [49.9, 71.5, 106.4, 129.2, 144.0, 176.0, 135.6, 148.5, 216.4, 194.1, 95.6, 54.4]
}]
});
});
});
///动态创建副图表
/// oject:对象内部可以封装很多数据 通用模式
/// widht:生成的副图表宽度
/// height:生成的副图表高度
/// left:图表距左侧窗体的距离值
/// top:图表距上侧窗体的距离值
///===============
function DynamicCreateSubChart(object, width, height, left, top) {
//动态设置副图表容器的相关属性并显示出来
$("#divChart").css({ "left": left, "top": top,"width":width,"height":height, "display": "block" });
///动态给div渲染图表
//这里可以再次进行封装 根据object内的参数动态渲染图表
new Highcharts.Chart({
chart: {
renderTo: "divChart"
},
title: {
text: object.title+"的详细数据"
},
credits: {
enabled: false
},
legend: {
enabled: false
},
series: [{
data: [1, 2, 4, 8]
}]
});
}
///隐藏副图表
function HiddenSubChart() {
$("#divChart").html("");
$("#divChart").css({ "display": "none" });
}
</script>
</head>
<body style="background:#DAE1E8">
<div id="container" style="width: 600px; z-index: 0; height: 400px; margin: 0 auto"></div>
<div id="divChart" style="position: absolute; display: -none; border: 3px solid green; z-index: 999;"></div>
</div>
</body>
</html>
