Run-Time Data Areas
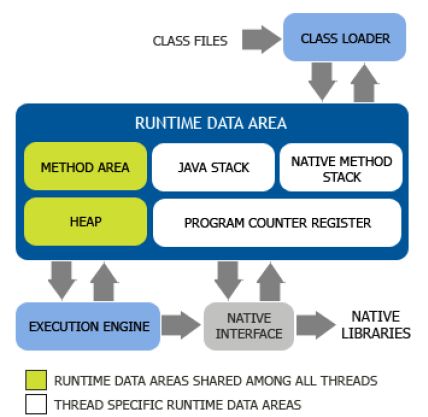
Class loader loads all the required class files into different runtime data areas:
Method Area, Heap, Java Stack, Native Method Stack, Program Counter Register.
Program Counter (PC) Register
The Program Counter (PC) Register is used as line number indicator of current thread.
The Java Virtual Machine can support many threads of execution at once. To support multiple thread execution, CPU processes requests of multiple threads in turns, but one CPU can only execute the command for one single thread at a specific time.
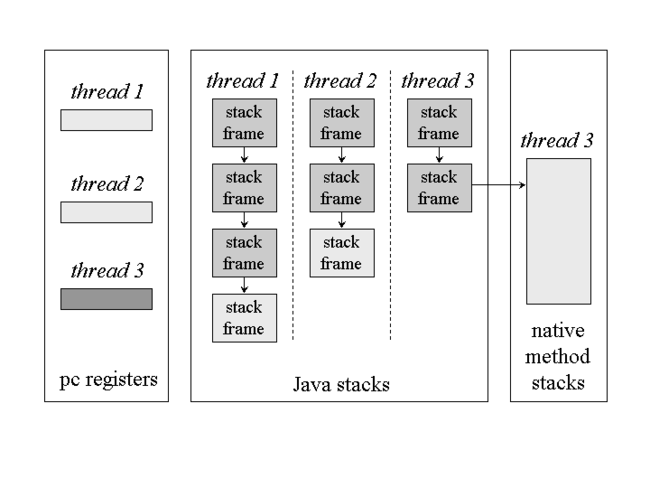
So in case that processor can still remember the last executing line number for current thread after thread switch, each Java Virtual Machine thread has its own pc (program counter) register to keep that line number.
Java Virtual Machine Stacks
Each Java Virtual Machine thread has a private Java Virtual Machine stack, created at the same time as the thread. A Java Virtual Machine stack stores frames.
It holds local variables and partial results, and plays a part in method invocation and return.
Each Java stack frame consists of three components, although at any given time one or more of the components may be empty:
- the local variables
- the operand stack
- the execution environment
A stack frame will be put into stack when a method invocation happens, and popped up when it returns. When another method is called within the method a new stack frame will be put into stack. Therefore, the unlimited recursion would cause a StackOverflowError.
In JVM specification, there are two kinds of exceptional conditions happened with Java Stacks:
If the current thread requires a Stack Frame which is located deeper than Java Stack permitted, the Java Virtual Machine throws a StackOverflowError.
Insufficient memory can be made available to create the initial JavaVirtual Machine stack for a new thread, the Java Stack throws an OutOfMemoryError.
Native Method Stacks
It works similar as Java Virtual Machine Stacks, except it handles the methods which are implemented by native language such as C. Like Java Stack, native method stacks are typically allocated per thread when each thread is created
The StackOverflowError and OutOfMemoryError can also be thrown if same exceptional conditions satisfied.
Heap
For most applications, Heap is the largest memory in JVM memory management.
Heap is shared among all Java Virtual Machine threads. And heap is the run-time data area from which memory for all class instances and arrays is allocated.
JVM Heap Memory Structure
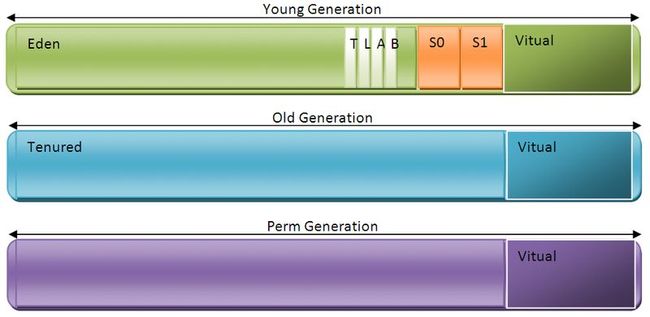
JVM Heap includes three parts:
· The Young Generation
· The Old Generation
· The Permenate Generation
Virtual Memory
System memory can be any of three status: Free, Reserved, Committed.
As we all know, the JVM memory is a big block of continuous memory. Before JVM allocates memory to Heap, JVM would reserve a big block memory as its Vitual Memory. For the part which it has been using is called Committed memory.
Based on Vitual Memory, the above three part are created.
Young Generation
The Young Generation consists of three parts:
· The Eden Space
· Survivor 0 Space
· Survivor 1 Space
Eden Space
Eden Space is the region where most objects are initially allocated.
Although Eden Space is shared among all the threads, JVM still assign a Thread Local Allocation Buffer (TLAB) for each thread for its object allocation to avoid contention and improve allocation efficency.Object allocation via a TLAB is a very cheap operation; it simply bumps a pointer for the object size which takes roughly 10 instructions on most platforms.
Because the objects allocation on TLAB does not need to lock memory, JVM would try to allocate object memory on TLAB for each thread firstly. When the object is too big or TLAB is fully occupied, the object allocation will be on the other parts of Heap. Hence, many small objects are more efficent than one big object.
-XX:TLABWasteTargetPercent : To set the percentage per TLAB on Eden, default value is 1%
-XX:+PrintTLAB :To check the TLAB status
Survivor 0 and Survivor 1 Space
These two spaces are also called: From Space and To Space.
These two space have the same size, but they are smaller than Eden Space. Compared with Eden Space, each Survivor Space are 1/8 smaller by default setting.
Survivor Spaces are used for Minor GC, more information will be coverred in Minor GC section.
Old Generation
Objects that live long enough are eventually promoted to the tenured space.
-Xms<size> 设置初始 Java 堆大小
-Xmx<size> 设置最大 Java 堆大小
-Xss<size> 设置 Java 线程堆栈大小
-XX:NewSize=n 设置年轻代大小
-XX:NewRatio=n 设置年轻代和年老代的比值。如:为3,表示年轻代与年老代比值为1:3,年轻代占整个年轻代年老代和的1/4
-XX:SurvivorRatio=n 年轻代中Eden区与两个Survivor区的比值。注意Survivor区有两个。如:3,表示Eden:Survivor=3:2,一个Survivor区占整个年轻代的1/5
-XX:MaxPermSize=n 设置持久代大小
Method Area
Method Area (also called: Perm Gen) is also shared among all Java Virtual Machine threads.
It stores per-class structures such as the run-time constant pool, field and method data, and the code for methods and constructors, including the special methods used in class and instance initialization and interface initialization.
The method area is created on virtual machine start-up. Although the method area is logically part of the heap, simple implementations may choose not to either garbage collect or compact it.
In hotspot JVM, Method area is called Permanent Generation. 永久代
When system loads too much class information, Permanent Generation could reach its maximum size (-XX:MaxPermSize=n), System will trigger a full GC if GC strategy is not set as CMS GC. If memory in the method area still cannot be made available to satisfy an allocation request after full GC, the Java Virtual Machine throws an OutOfMemoryError.
Run-Time Constant Pool
A run-time constant pool is a per-class or per-interface run-time representation of the constant pool table in a class file.
It contains several kinds of constants, ranging from numeric literals known at compile-time to method and field references that must be resolved at run-time.
The run-time constant pool serves a function similar to that of a symbol table for a conventional programming language, although it contains a wider range of data than a typical symbol table.
Each run-time constant pool is allocated from the Java Virtual Machine's Method Area. The run-time constant pool for a class or interface is constructed when the class or interface is created by the Java Virtual Machine.
Direct Memory
Direct Memory does not either belong to Java Run-Time Data Areas, or defined in memory management of JVM specification, but still it is used frequently, and also could trigger OutOfMemoryError.
When NIO is introduced in JDK1.4, developer can use an approach based on Channel and Buffer to manage I/O. It uses native lib methods to direct access memory out of JVM management, and manage the memory by using DirectByteBuffer object.
Such Direct Memory access approach is not limited by Heap size, but still it is limited by system memory. When Direct Memory plus Heap exceeded the max size of total memory, it will cause OutOfMemoryError.
VirtualGC in VirtualVM
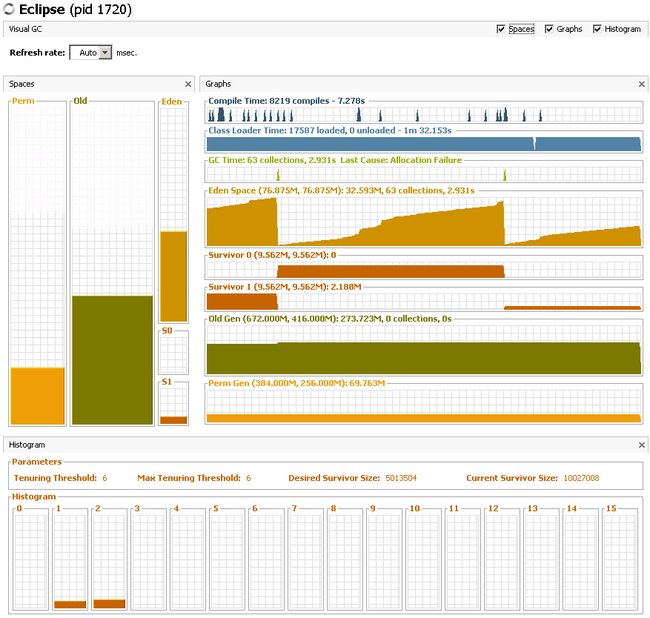
To see the dynamic nature of GC, launch JVisualVM and install the Visual GC plugin. This will enable you to see the GC in action for your application as below.
Object Representation
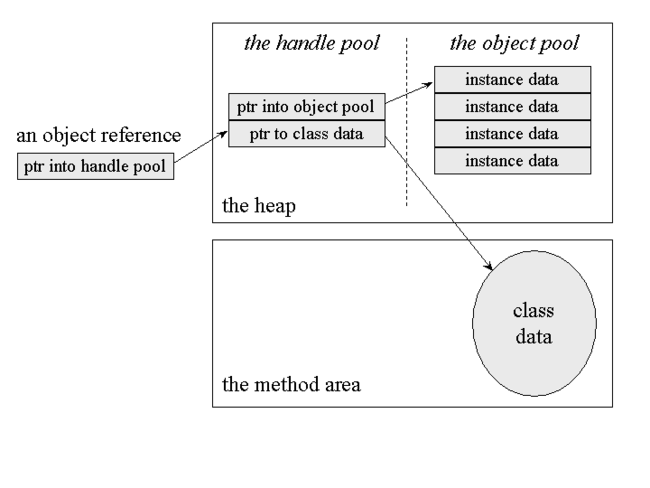
One possible heap design divides the heap into two parts: a handle pool and an object pool. An object reference is a native pointer to a handle pool entry. A handle pool entry has two components: a pointer to instance data in the object pool and a pointer to class data in the method area.
l The advantage of this scheme is that it makes it easy for the virtual machine to combat heap fragmentation. When the virtual machine moves an object in the object pool, it need only update one pointer with the object's new address: the relevant pointer in the handle pool.
l The disadvantage of this approach is that every access to an object's instance data requires dereferencing two pointers.
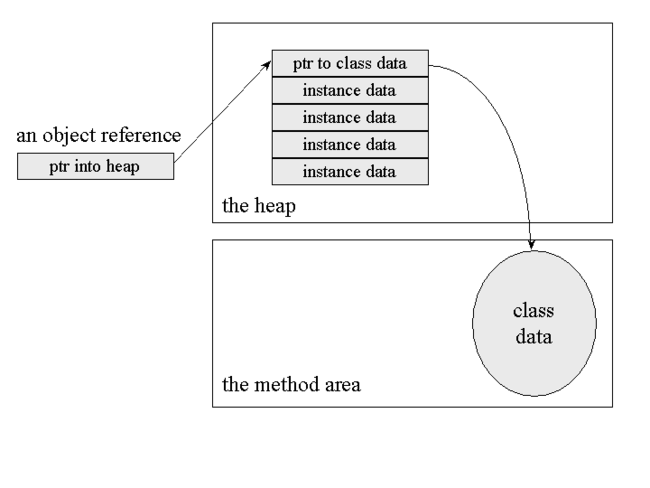
Another design makes an object reference a native pointer to a bundle of data that contains the object's instance data and a pointer to the object's class data.
l This approach requires dereferencing only one pointer to access an object's instance data, which is quicker to access instance.
l But makes moving objects more complicated. When the virtual machine moves an object to combat fragmentation of this kind of heap, it must update every reference to that object anywhere in the runtime data areas.
