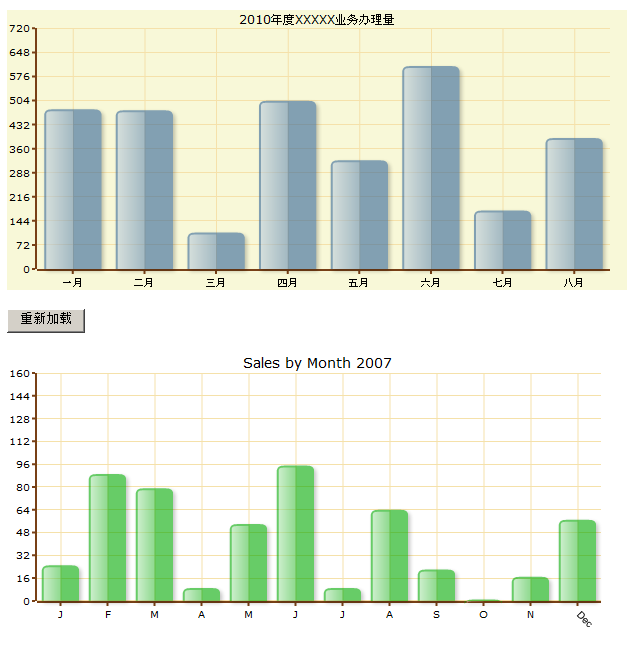
OpenFlashChartDemo动态数据显示
<%@ page language="java" import="java.util.*" pageEncoding="UTF-8"%>
<html>

<script type="text/javascript" src="<%=request.getContextPath() %>/ofc2/swfobject.js"></script>
<script type="text/javascript" src="<%=request.getContextPath() %>/ofc2/json2.js"></script>

<body>
   <div id="div1"></div>
   <p><input type="button" value="重新加载" onclick="reload1()" >  </p>
   <div id="div2" ></div>
</body>
</html>

<script type="text/javascript" language="javascript">
//定义第一个Flash控件
swfobject.embedSWF("<%=request.getContextPath() %>/ofc2/open-flash-chart.swf", "div1", "50%", "280","9.0.0", "expressInstall.swf",
 {"data-file" : "<%=request.getContextPath() %>/servlet/GlassChartServlet"},
 {wmode : "transparent"}
);

//定义第二个Flash控件
swfobject.embedSWF("<%=request.getContextPath() %>/ofc2/open-flash-chart.swf", "div2", "50%", "280","9.0.0", "expressInstall.swf",
 {"data-file" : "<%=request.getContextPath() %>/servlet/GlassChartServlet"},
 {wmode : "transparent"}
);

//根据请求一个URL,重新加载第一个Flash控件的数据
function reload1()
{
  tmp = findSWF("div1");
  x = tmp.reload( "<%=request.getContextPath() %>/servlet/GlassChartServlet" );
}


//第二个Flash控件,直接加载JSON数据
function reload2()
{
  tmp = findSWF("div2");
  x = tmp.load( JSON.stringify(getNewData()) );
}

//生成一个JSON数据对象
function getNewData()
{
  var arraylist=[
    parseInt(100*Math.random()),
    parseInt(100*Math.random()),
    parseInt(100*Math.random()),
    parseInt(100*Math.random()),
    parseInt(100*Math.random()),
    parseInt(100*Math.random()),
    parseInt(100*Math.random()),
    parseInt(100*Math.random()),
    parseInt(100*Math.random()),
    parseInt(100*Math.random()),
    parseInt(100*Math.random()),
    parseInt(100*Math.random())
    ];

	var data = {
		"title":{"text":"Sales by Month 2007","style":"font-size: 14px; font-family: Verdana; text-align: center;"},
		"x_axis":{"labels":{"labels":["J","F","M","A","M","J","J","A","S","O","N",{"text":"Dec", "colour":"#000000", "size":10, "rotate":45}]}},
		"y_axis":{"steps":16, "max":160},
		"bg_colour":"#ffffff",
		"elements":[{"type":"bar_glass", "tip":"$#val#", "values":arraylist, "colour":"#00aa00"}]
	}

	return data;
}

//定时器,自动重新加载数据
setInterval(reload2,"1000");

//查找SWF控件
function findSWF(movieName)
{
  if (navigator.appName.indexOf("Microsoft")!= -1) {
    return window[movieName];
  } else {
    return document[movieName];
  }
}

</script>
package com.flashchart;

import java.io.IOException;
import java.io.PrintWriter;
import java.util.LinkedHashMap;
import java.util.Map;
import java.util.Map.Entry;

import javax.servlet.ServletException;
import javax.servlet.http.HttpServlet;
import javax.servlet.http.HttpServletRequest;
import javax.servlet.http.HttpServletResponse;

import jofc2.model.Chart;
import jofc2.model.Text;
import jofc2.model.axis.XAxis;
import jofc2.model.axis.YAxis;
import jofc2.model.elements.BarChart;
import jofc2.model.elements.BarChart.Bar;

public class GlassChartServlet extends HttpServlet {

	protected void doGet(HttpServletRequest request, HttpServletResponse response) throws ServletException, IOException {
		 response.setContentType("application/json");
	     response.setHeader("Cache-Control", "no-cache");
	     response.setCharacterEncoding("UTF-8");
	     PrintWriter out = response.getWriter();

	     Map<String, Long> dataMap = new LinkedHashMap<String, Long>();
	     String[] month={"一月","二月","三月","四月","五月","六月","七月","八月"};
	     for(int i=0;i<8;i++)
	     {
	    	 dataMap.put(month[i],Math.round(Math.random()*710));
	     }

	     Chart ofc2Chart = new Chart();
	     Text title = new Text("2010年度XXXXX业务办理量");
	     ofc2Chart.setTitle(title);

	     BarChart barChart = new BarChart(BarChart.Style.GLASS); // 设置条状图样式

	     XAxis x = new XAxis();                                  // X 轴
	     for (Entry<String, Long> entry : dataMap.entrySet())
	     {
	         x.addLabels(entry.getKey());                        // x 轴的文字
	         Bar bar = new Bar(entry.getValue(),"起 ");
	         bar.setColour("0x336699");                          // 颜色
	         bar.setTooltip(entry.getValue() + "起 ");           // 鼠标移动上去后的提示
	         barChart.addBars(bar);

	     }

	     ofc2Chart.addElements(barChart);
	     ofc2Chart.setXAxis(x);

	     double ymax = 720d;     // Y 轴最大值
	     YAxis y = new YAxis();  // y 轴
	     y.setMax(ymax + 1.0);   // y 轴最大值
	     y.setSteps(ymax / 10);  // y 轴步进
	     ofc2Chart.setYAxis(y);

	     String jsonChart = ofc2Chart.toString();
	     out.write(jsonChart);

	     out.flush();
	     out.close();
		}
}
function reload()
{
  tmp = findSWF("chart");

  //
  // reload the data:
  //
  x = tmp.reload();

  //
  // to load from a specific URL:
  // you may need to 'escape' (URL escape, i.e. percent escape) your URL if it has & in it
  //
  x = tmp.reload("gallery-data-32.php?beer=1");

  //
  // do NOT show the 'loading...' message:
  //
  x = tmp.reload("gallery-data-32.php?beer=1", false);
}

function findSWF(movieName) {
  if (navigator.appName.indexOf("Microsoft")!= -1) {
    return window["ie_" + movieName];
  } else {
    return document[movieName];
  }
}
按照官方资料,我在设置第二个参数时,它就报错,这里先记下了,有待解决?
// do NOT show the 'loading...' message:
x = tmp.reload( "<%=request.getContextPath() %>/servlet/GlassChartServlet",false );
上一张效果图,如下:
