TKPROF解析
TKPROF命令
之前我们收集的trace日志仍为Raw Trace,如果要做性能分析的话,往往要转换为TKPROF,TKPROF可以把Raw Trace转换为更易读的形式。
TKPROF Command
$tkprof tracefile outputfile [explain= ] [table= ] [print= ] [insert= ] [sys= ] [sort= ] ...

Sample:
TKPROF raw_trace.trc OUTPUTA.TKPROF EXPLAIN=scott/tiger SYS=NO SORT=(EXECPU,FCHCPU)
tracefile:你要分析的trace文件
outputfile:格式化后的文件
explain=user/password@connectstring(如果需要生成执行计划,需要这项,默认是没有执行计划的,只有Row Source Operation)
table=schema.tablename
注1:这两个参数是一起使用的,通过连接数据库对在trace文件中出现的每条sql语句查看执行计划,并将之输出到outputfile中
注2:该table必须是数据库中不存在的,如果存在会报错
print=n:只列出最初N个sql执行语句
insert=filename:会产生一个sql文件,运行此文件可将收集到的数据insert到数据库表中
sys=no:过滤掉由sys执行的语句
record=filename:可将非嵌套执行的sql语句过滤到指定的文件中去
waits=yes|no:是否统计任何等待事件
aggregate=yes|no:是否将相同sql语句的执行信息合计起来,默认为yes
sort=option:设置排序选项,选项如下:
prscpu:cpu time parsing
prsela:elapsed time parsing
prsdsk:number of disk reads during parse
prsqry:number of buffers for consistent read during parse
prscu:number of buffers for current read during parse
prsmis:number of misses in library cache during parse
execnt:number of execute was called
execpu:cpu time spent executing
exeela:elapsed time executing
exedsk:number of disk reads during execute
exeqry:number of buffers for consistent read during execute
execu:number of buffers for current read during execute
exerow:number of rows processed during execute
exemis:number of library cache misses during execute
fchcnt:number of times fetch was called
fchcpu:cpu time spent fetching
fchela:elapsed time fetching
fchdsk:number of disk reads during fetch
fchqry:number of buffers for consistent read during fetch
fchcu:number of buffers for current read during fetch
fchrow:number of rows fetched
userid:userid of user that parsed the cursor
Tkprof: Release 9.2.0.1.0 - Production on Tue Dec 24 15:32:43 2002
Copyright (c) 1982, 2002, Oracle Corporation.  All rights reserved.

Trace file: ORCL102_ora_3064.trc

Sort options: default

********************************************************************************
count    = number of times OCI procedure was executed
cpu      = cpu time in seconds executing
elapsed  = elapsed time in seconds executing
disk     = number of physical reads of buffers from disk
query    = number of buffers gotten for consistent read
current  = number of buffers gotten in current mode (usually for update)
rows     = number of rows processed by the fetch or execute call
********************************************************************************

select *
from
 employee where emp_id = 3737

call     count       cpu    elapsed       disk      query    current        rows
------- ------  -------- ---------- ---------- ---------- ----------  ----------
Parse       10      0.00       0.03          0          0          0           0
Execute     10      0.00       0.00          0          0          0           0
Fetch       20      0.34       0.35         72       4730          0          10
------- ------  -------- ---------- ---------- ---------- ----------  ----------
total       40      0.34       0.39         72       4730          0          10

Misses in library cache during parse: 1
Optimizer goal: CHOOSE
Parsing user id: 59

Rows     Row Source Operation
-------  ---------------------------------------------------
      1  TABLE ACCESS FULL EMPLOYEE
TKPROF中的标识
| Column Value |
Meaning |
| PARSE |
Translates the SQL statement into an execution plan, including checks for proper security authorization and checks for the existence of tables, columns,and other referenced objects. |
| EXECUTE |
Actual execution of the statement by Oracle. For INSERT, UPDATE, and DELETE statements, this modifies the data. For SELECT statements, this identifies the selected rows. |
| FETCH |
Retrieves rows returned by a query. Fetches are only performed forSELECT statements. |
| COUNT |
Number of times a statement was parsed, executed, or fetched. |
| CPU |
Total CPU time in seconds for all parse, execute, or fetch calls for the statement. This value is zero (0) ifTIMED_STATISTICS is not turnedon. |
| ELAPSED |
Total elapsed time in seconds for all parse, execute, or fetch calls for the statement. This value is zero (0) ifTIMED_STATISTICS is not turned on. |
| DISK |
Total number of data blocks physically read from the data files on disk for all parse, execute, or fetch calls. |
| QUERY |
Total number of buffers retrieved in consistent mode for all parse, execute,or fetch calls. Usually, buffers are retrieved in consistent mode for queries. |
| CURRENT |
Total number of buffers retrieved in current mode. Buffers are retrieved in current mode for statements such asINSERT,UPDATE, andDELETE. |
| ROWS |
Total number of rows processed by the SQL statement. This total does not include rows processed by sub queries of the SQL statement. |
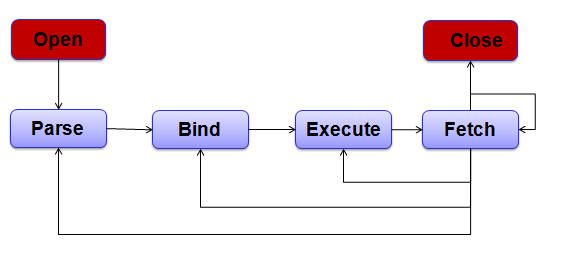
Parse:这步将SQL语句转换成执行计划,包括检查是否有正确的授权和所需要用到的表、列以及其他引用到的对象是否存在。
Execute:这步是真正的由Oracle来执行语句。对于insert、update、delete操作,这步会修改数据,对于select操作,这步就只是确定选择的记录。
Fetch:返回查询语句中所获得的记录,这步只有select语句会被执行。
SQL处理的不同的阶段
COUNT:这个语句被parse、execute、fetch的次数。
CPU:这个语句对于所有的parse、execute、fetch所消耗的cpu的时间,以秒为单位。
ELAPSED:这个语句所有消耗在parse、execute、fetch的总的时间。
DISK:执行物理I/O次数,从磁盘上的数据文件中物理读取的块的数量。一般来说更想知道的是正在从缓存中读取的数据而不是从磁盘上读取的数据。
QUERY:在意一致性检索方式获得块时,执行逻辑I/O次数;在一致性读模式下,所有parse、execute、fetch所获得的buffer的数量。一致性模式的buffer是用于给一个长时间运行的事务提供一个一致性读的快照,缓存实际上在头部存储了状态。
CURRENT:逻辑I/O次数,在current模式下所获得的buffer的数量。一般在current模式下执行insert、update、delete操作都会获取buffer。在current模式下如果在高速缓存区发现有新的缓存足够给当前的事务使用,则这些buffer都会被读入了缓存区中。
ROWS: 此阶段,被处理或受影响的行数,所有SQL语句返回的记录数目,但是不包括子查询中返回的记录数目。对于select语句,返回记录是在fetch这步,对于insert、update、delete操作,返回记录则是在execute这步。
经验总结
- Query + Current = Logical Reads (total number of buffers accessed)
- Parse count/Execute count parse count应尽量接近1,如果太高的话,SQL会进行不必要的reparse
- rows Fetch/Fetch Fetch Array的大小,太小的话就没有充分利用批量Fetch的功能,增加了数据在客户端和服务器之间的往返次数。
- disk/query+current 磁盘IO所占逻辑IO的比例,太大的话有可能是db_buffer_size过小(也跟SQL的具体特性有关)
- elapsed/cpu 太大表示执行过程中花费了大量的时间等待某种资源
- cpu Or elapsed 太大表示执行时间过长,或消耗了了大量的CPU时间,应该考虑优化
- 执行计划中的Rows 表示在该处理阶段所访问的行数,要尽量减少
- DISK是从磁盘上的数据文件中物理读取的块的数量。一般来说更想知道的是正在从缓存中读取的数据而不是从磁盘上读取的数据。
Explain plan
产生Explain Plan的方法,在执行tkprof时,加入Explain=Username/pwd参数.
Explain plan可能并不准,执行计划是指在此时此刻对于query的一个“评估”,在真实执行中,环境数据可能会有变化,所以执行计划也可能会有变化。
Tom的说法:explain plan always does a hard parse, it evaluated the query plan "in the here and now, as of this moment in time". It dynamically sampled the table again - found it to be large and ID=1 to not be selective. Explain plan shows us that if we hard parsed that query right now - it would full scan. However, all executions of that query in "real life" will index range scan as long as that plan is cached in the shared pool...
另外,如果不需要看执行计划的话,不一定非得要在收集日志的环境中执行tkprof,只要你有raw trace,在哪里执行tkprof命令都是一样的。
Row Source Operation
Rows     Row Source Operation
-------  ---------------------------------------------------
      0  UPDATE  MTL_MWB_GTMP (cr=148 pr=0 pw=0 time=8506 us)
    152   TABLE ACCESS FULL MTL_MWB_GTMP (cr=140 pr=0 pw=0 time=8794 us cost=40 size=35960 card=124)
      1   NESTED LOOPS  (cr=8 pr=0 pw=0 time=60 us cost=3 size=65 card=1)
      1    TABLE ACCESS BY INDEX ROWID MTL_SYSTEM_ITEMS_B (cr=5 pr=0 pw=0 time=34 us cost=2 size=16 card=1)
      1     INDEX UNIQUE SCAN MTL_SYSTEM_ITEMS_B_U1 (cr=2 pr=0 pw=0 time=11 us cost=1 size=0 card=1)(object id 1030503)
      1    TABLE ACCESS BY INDEX ROWID MTL_SYSTEM_ITEMS_TL (cr=3 pr=0 pw=0 time=22 us cost=1 size=49 card=1)
      1     INDEX UNIQUE SCAN MTL_SYSTEM_ITEMS_TL_U1 (cr=2 pr=0 pw=0 time=15 us cost=0 size=0 card=1)(object id 38056)
cr是一致性模式下逻辑读出的数据块数。
pr是从磁盘物理读出的数据块数。
pw是物理写入磁盘的数据块数。
time是以微秒表示的总的消逝时间。要注意根据统计得到的值不总是精确的。实际上,为了减少开销,可能用了采样。
cost是操作的评估开销。这个值只有在Oracle 11g才提供。
size是操作返回的预估数据量(字节数)。这个值只有在Oracle 11g才提供。
card是操作返回的预估行数。这个值只有在Oracle 11g才提供。
Row Source Operation和Explain plan的关系
Note how the "Row Source Operation" (what I like tocall 'reality') differs from the "Execution Plan" (I'll call that the 'guess'). What happened here was that the row source operation is captured in the trace file at the time of execution - it reflects what REALLY took place as that query executed.
Row source operation, is WHAT HAPPENED, for real.
Explain plan, shows what MIGHT happen.
参见TOM的解释,See:http://blog.csdn.net/pan_tian/article/details/7677549
转载请注明出处:http://blog.csdn.net/pan_tian/article/details/7677338