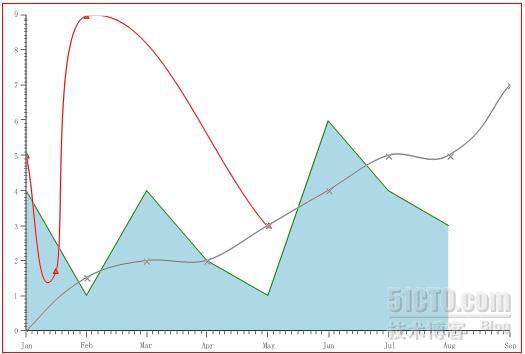
dojo+线性图
1.js脚本:
- dojo.require("dojox.charting.Chart2D");
dojo.require("dojox.charting.plot2d.Pie");
dojo.require("dojox.charting.action2d.Highlight");
dojo.require("dojox.charting.action2d.MoveSlice");
dojo.require("dojox.charting.action2d.Tooltip");
dojo.require("dojox.charting.themes.MiamiNice");
dojo.require("dojox.charting.widget.Legend");- makeCharts = function(){
- var chart1 = new dojox.charting.Chart2D("simplechart");
- /* type:
- * Lines,Markers,Areas,MarkersOnly
- */
- //chart1.addPlot("default", {type: "Lines"});
- //chart1.addPlot("default", {type: "StackedAreas", lines: true, areas: true, markers: false});
- chart1.addPlot("default", {type: "Lines", markers: true,tension: "X", shadows: {dx: 2, dy: 2}});
- chart1.addPlot("other", {type: "Areas"});
- chart1.addPlot("Grid", {type: "Grid",
- hAxis: "other x",
- vAxis: "other y",
- hMajorLines: true,
- hMinorLines: false,
- vMajorLines: true,
- vMinorLines: false
- });
- //chart1.addAxis("x");
- chart1.addAxis("x", {
- labels: [
- {value: 1, text: "Jan"},{value: 2, text: "Feb"},
- {value: 3, text: "Mar"}, {value: 4, text: "Apr"},
- {value: 5, text: "May"}, {value: 6, text: "Jun"},
- {value: 7, text: "Jul"}, {value: 8, text: "Aug"},
- {value: 9, text: "Sep"}, {value: 10, text: "Oct"},
- {value: 11, text: "Nov"}, {value: 12, text: "Dec"}
- ]
- });
- chart1.addAxis("y", {vertical: true});
- chart1.addSeries("Series 1", [0,1.5, 2, 2, 3, 4, 5, 5, 7]);
- chart1.addSeries("Series 2", [4, 1, 4, 2, 1, 6, 4, 3], {plot: "other", stroke: {color:"green"}, fill: "lightblue"});
- chart1.addSeries("Series A", [{x: 1, y: 5}, {x: 1.5, y: 1.7},{x: 2, y: 9}, {x: 5, y: 3}],{stroke: {color:"red"}});
- chart1.render();
- };
- dojo.addOnLoad(makeCharts);
2.HTML代码:
- <div id="simplechart" style="width: 600px; height: 400px;"></div>
3.页面展示效果:
