check_mk for nagios 笔记
all WATO config files:
/usr/local/check_mk/etc/conf.d/wato
/usr/local/check_mk/etc/multisite.d/wato
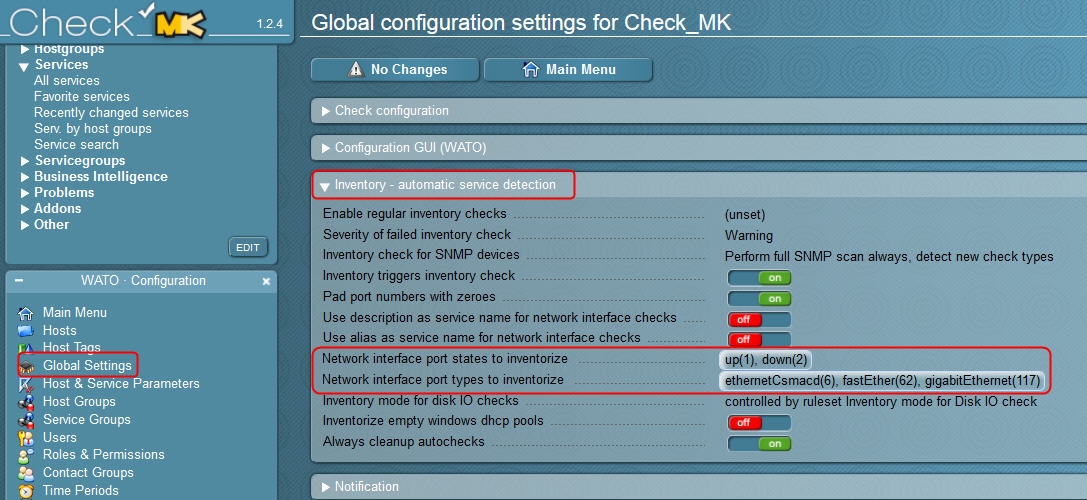
Global settings tuning
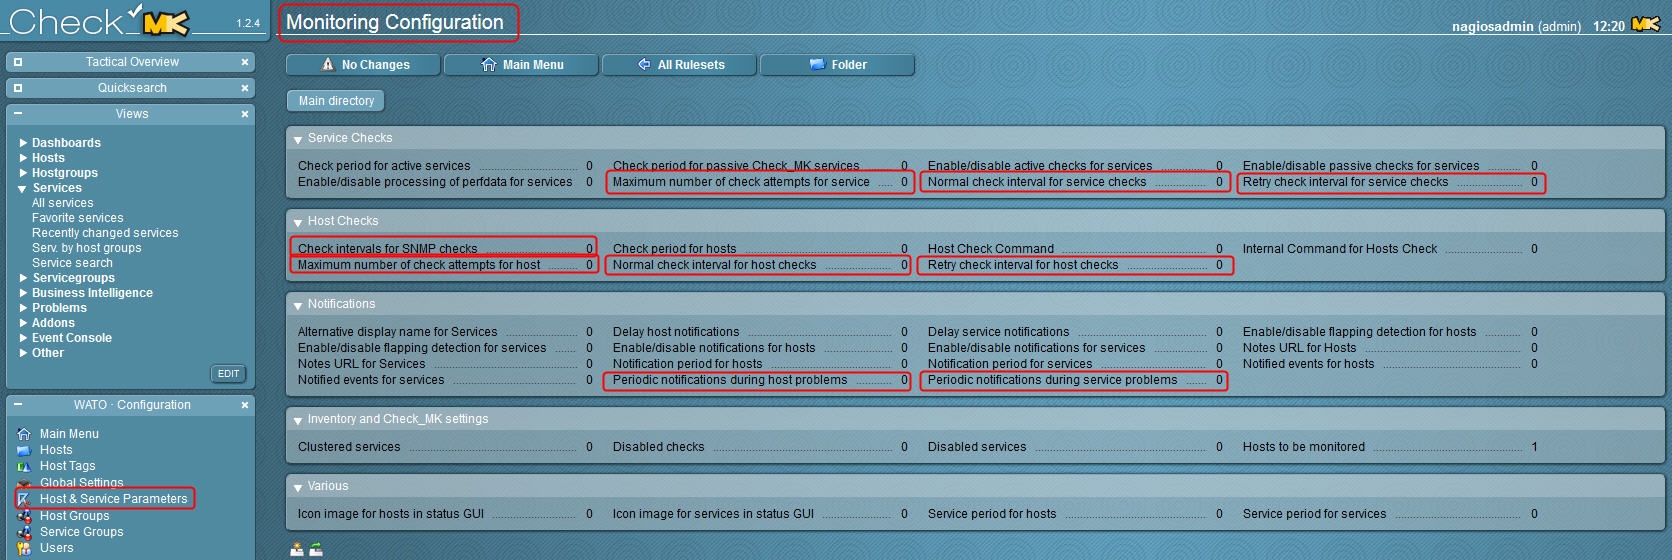
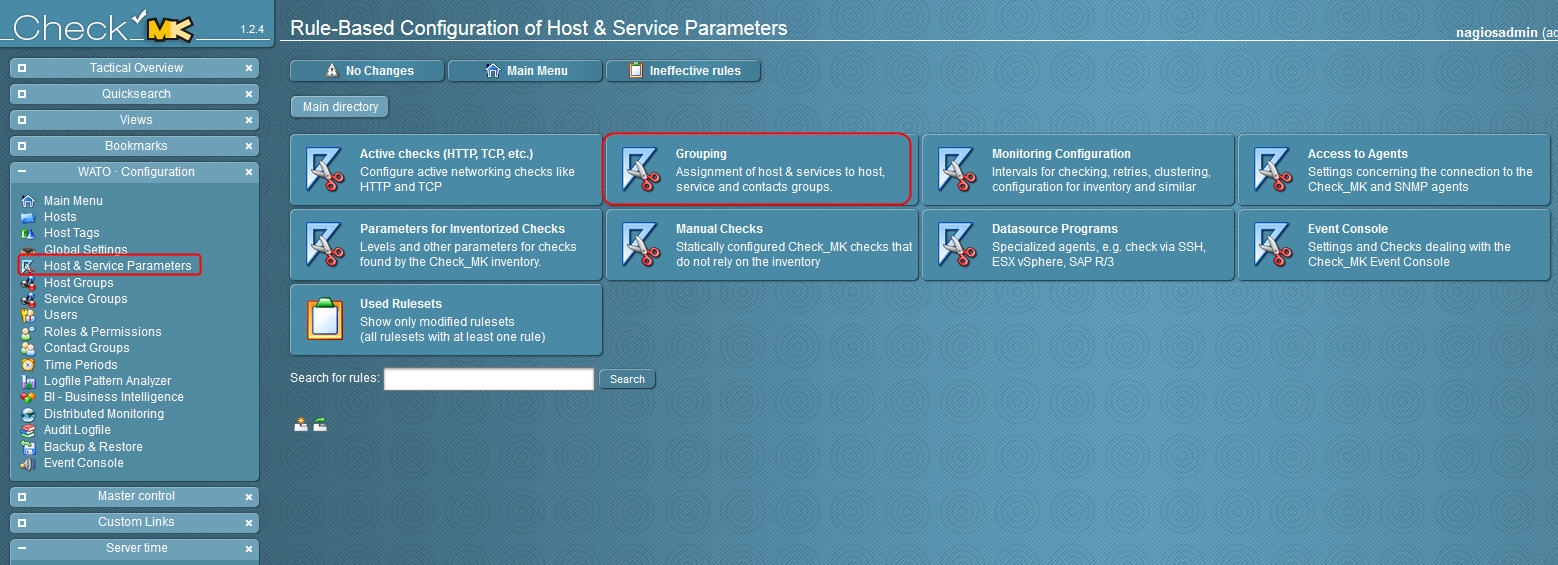
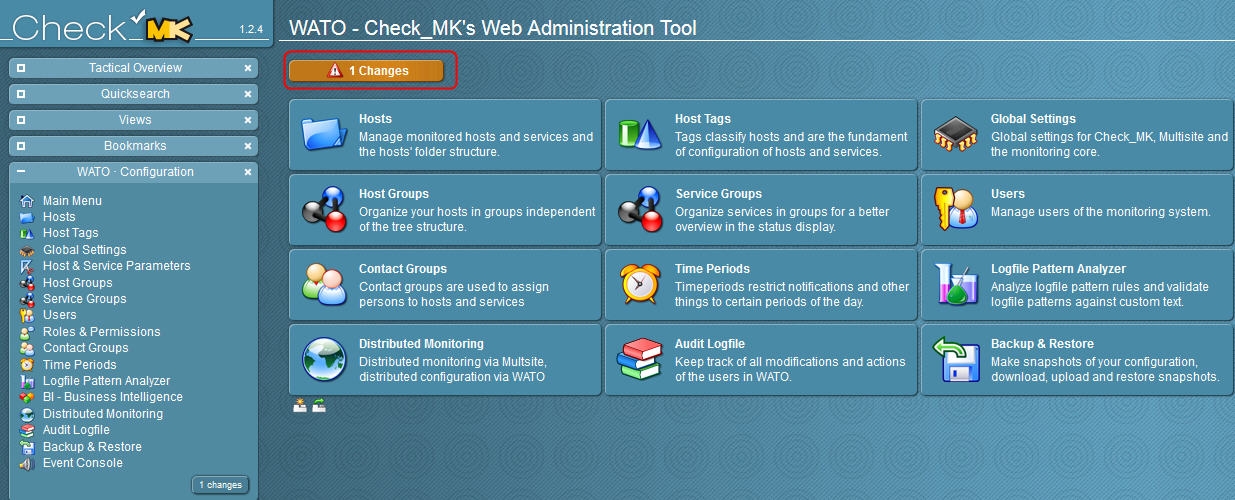
add host/service/contact to hostgroups/servicegroups/contactgroups
1. create hostgroups/servicegroups/contactgroups

2. add host/service/contact to hostgroups/servicegroups/contactgroups

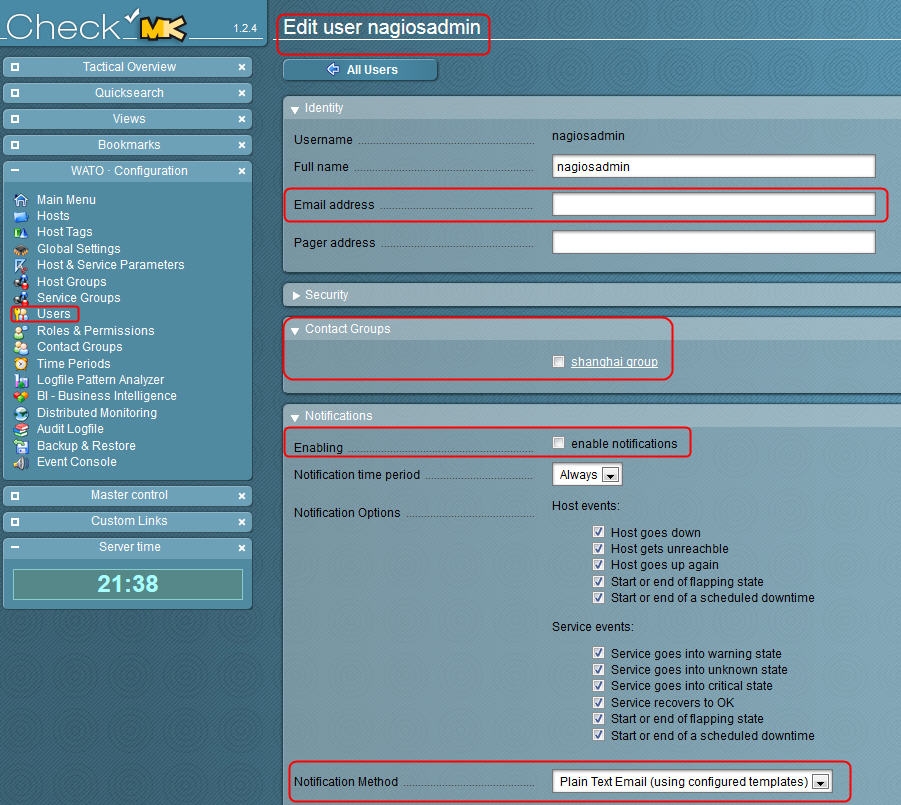
3. for add contact to contactgroups
4. apply changes
SNMP Checks config
1. on Cisco router/switch to set snmp community:
snmp-server community public ro
2. on Check_MK to check snmp manually:
snmpwalk -v 2c -c public cisco_router_ip
3. on Check_mk server WATO
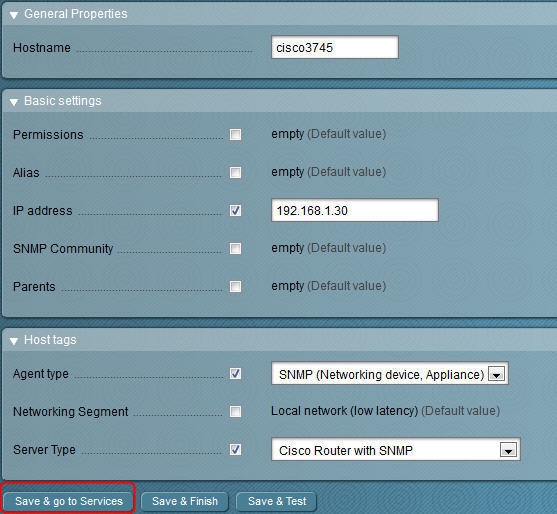
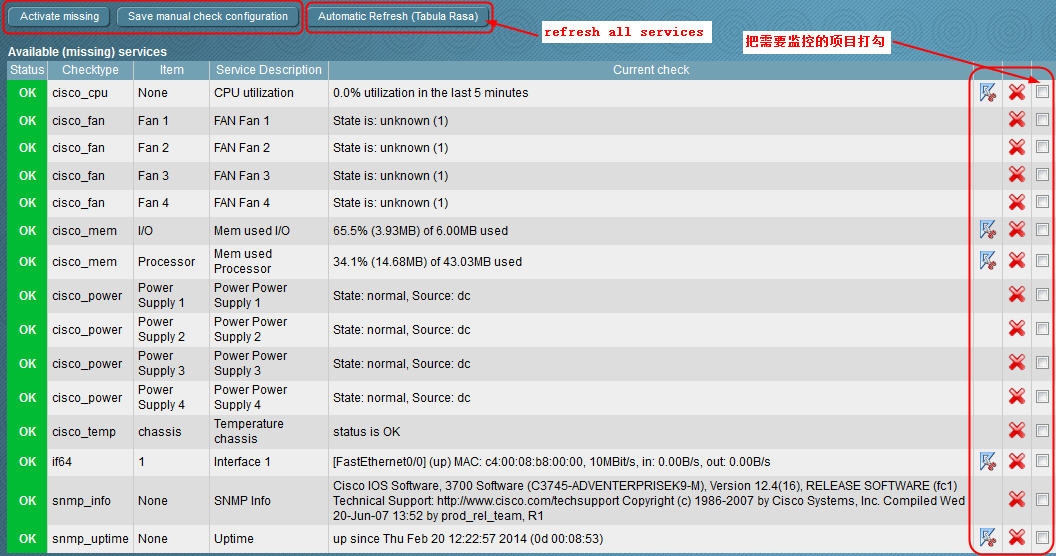
Notes: default community is "public", you can config individually in WATO
/usr/local/check_mk/bin/cmk -D cisco3745 to check it's config or in WATO
Add just ping check for devices
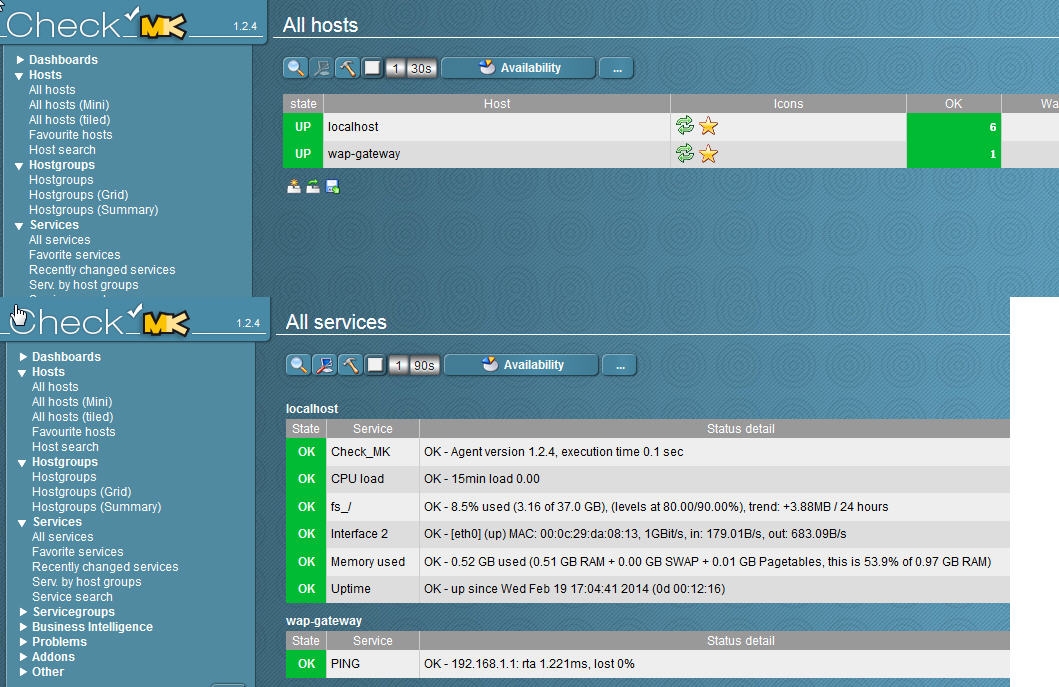
1. add hosts in WATO
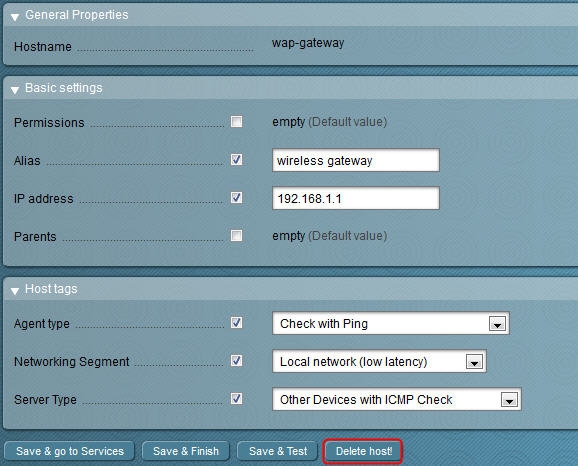

5. check it in WATO
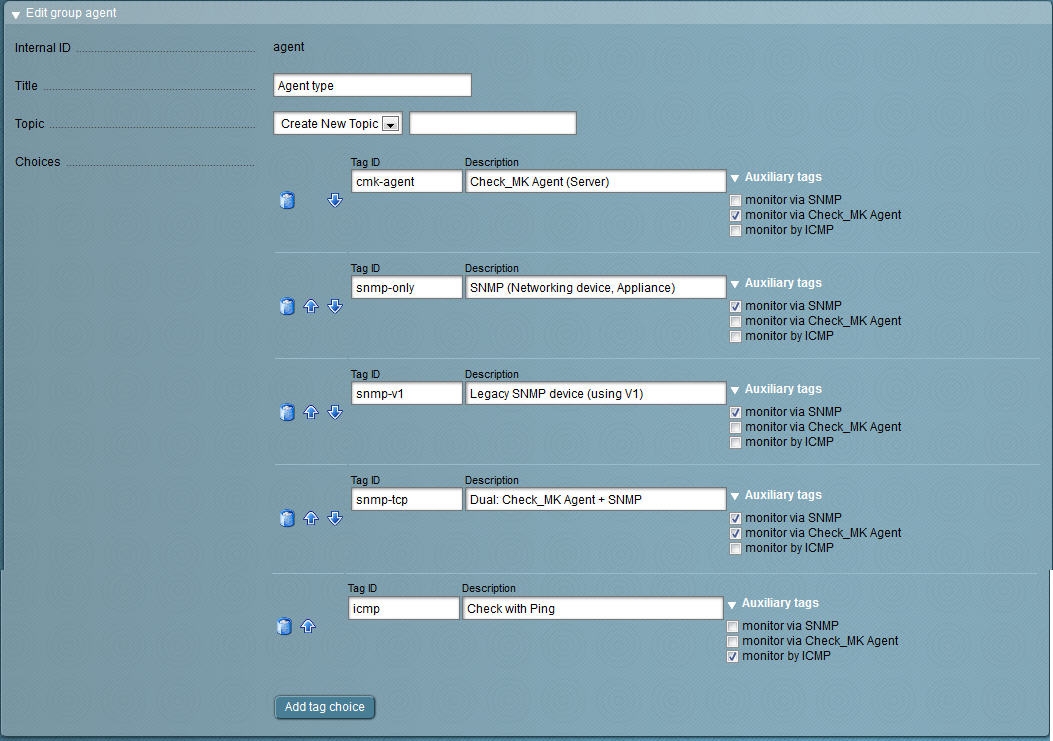
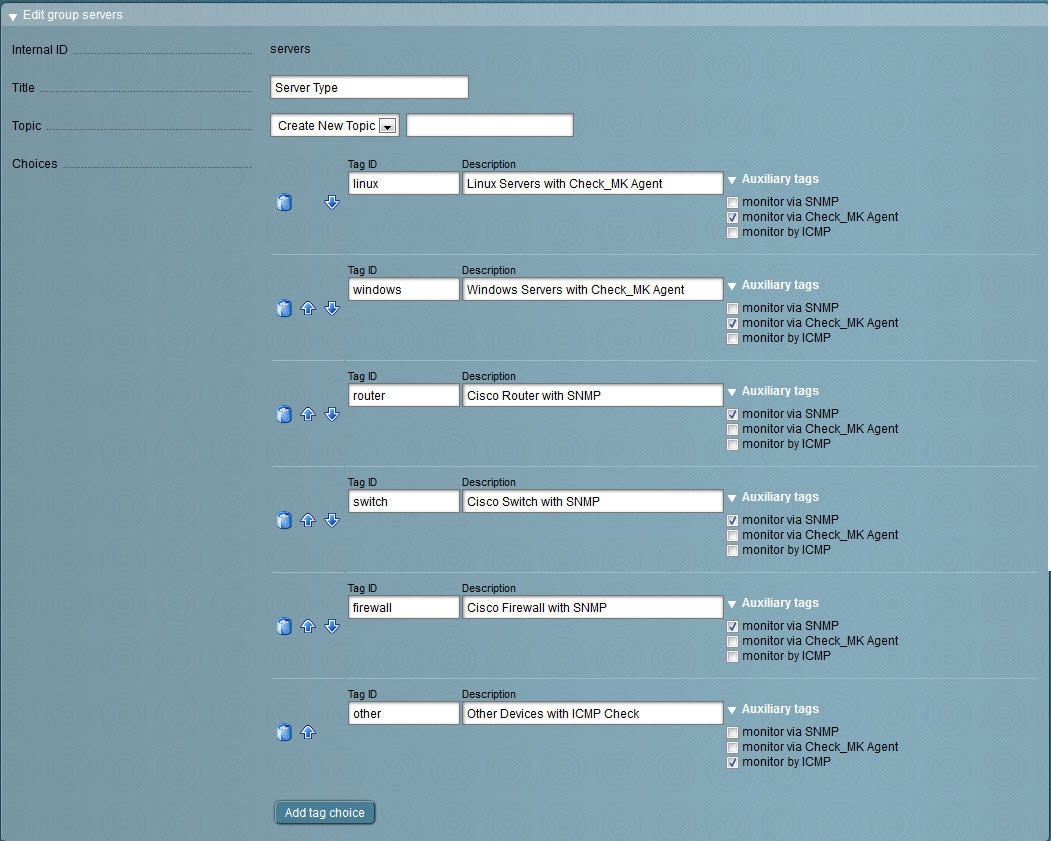
Host Tags
1. create host tags in WATO

Monitoring of Logfiles with Logwatch
1. make sure to install logwatch rpm
rpm -ivh check_mk-agent-1.2.4-1.noarch.rpm
rpm -ivh check_mk-agent-logwatch-1.2.4-1.noarch.rpm
2. vi /etc/check_mk/logwatch.cfg
/var/log/messages
I OK # lines containing OK are ignored, priority from top to bottom
C Critical # lines containing Critical
W Warn # lines containing Warn
W Error # lines containing Error
W Fail # lines containing Fail
/var/log/maillog
I OK # lines containing OK are ignored, priority from top to bottom
C Critical # lines containing Critical
W Warn # lines containing Warn
W Error # lines containing Error
W Fail # lines containing Fail
/usr/local/nagios/var/nagios.log
I OK # lines containing OK are ignored, priority from top to bottom
C Critical # lines containing Critical
W Warn # lines containing Warn
W Error # lines containing Error
W Fail # lines containing Fail
Notes: it's case sensitive for messages, so you should define it carefully
3. You can also use WATO
/usr/local/check_mk/bin/cmk -I localhost
vi /usr/local/check_mk/var/autochecks/localhost.mk to remove unwanted item as you needed
/usr/local/check_mk/bin/cmk -R
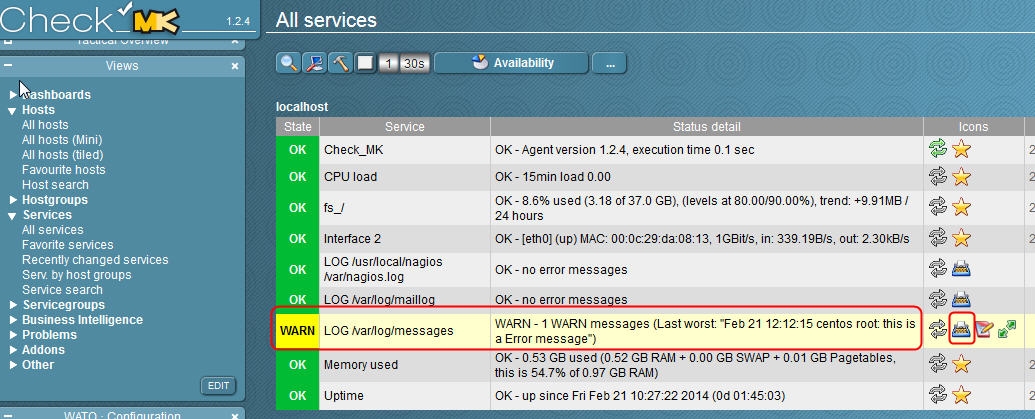
4. you can test it with logger command
logger "this is a Error message"
Monitoring MySQL
/usr/local/check_mk/bin/cmk -d localhost | head
PluginsDirectory: /usr/lib/check_mk_agent/plugins
LocalDirectory: /usr/lib/check_mk_agent/local
SpoolDirectory: /etc/check_mk/spool
AgentDirectory: /etc/check_mk
1. cp -a /usr/local/check_mk/share/agents/plugins/mk_mysql /usr/lib/check_mk_agent/plugins/
chmod 755 /usr/lib/check_mk_agent/plugins/*
2. You can also use WATO
/usr/local/check_mk/bin/cmk -I localhost
vi /usr/local/check_mk/var/autochecks/localhost.mk to remove unwanted item as you needed
/usr/local/check_mk/bin/cmk -R

Monitoring any linux job
1. please refer http://hj192837.blog.51cto.com/655995/1352370 for testing script
2. vi /etc/cron.d/check-cisco
MAILTO=
0 10,17 * * * root mk-job ping-cisco-job /tmp/pingtest.sh
service crond restart
3. after the first run of the job the only thing to do is to run a service inventory on the host and restart your monitoring process.
You can also use WATO
/usr/local/check_mk/bin/cmk -I localhost
vi /usr/local/check_mk/var/autochecks/localhost.mk to remove unwanted item as you needed
/usr/local/check_mk/bin/cmk -R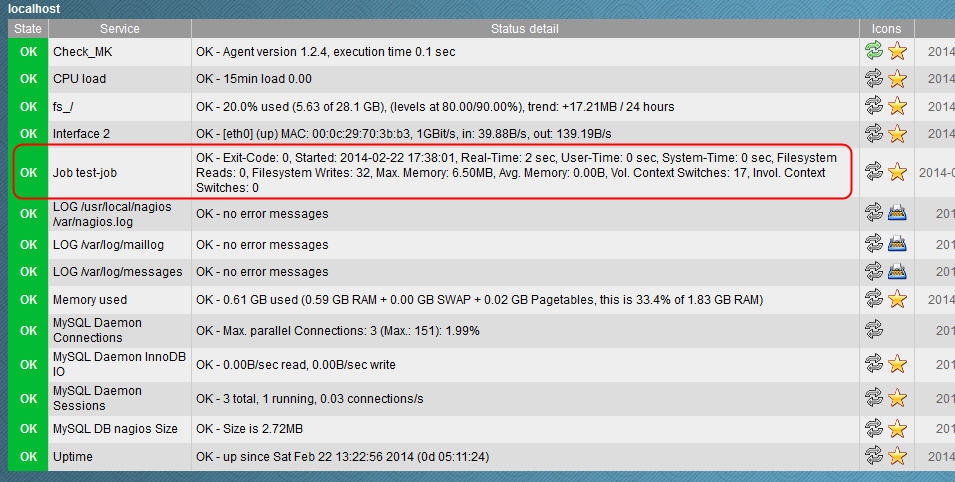
Setup Distributed Monitoring
1. on distributed monitored check_mk server
cp -a /usr/local/check_mk/bin/unixcat /usr/bin
vi /etc/xinetd.d/livestatus
service livestatus
{
type = UNLISTED
port = 6557
socket_type = stream
protocol = tcp
wait = no
# limit to 100 connections per second. Disable 3 secs if above.
cps = 100 3
# set the number of maximum allowed parallel instances of unixcat.
# Please make sure that this values is at least as high as
# the number of threads defined with num_client_threads in
# etc/mk-livestatus/nagios.cfg
instances = 500
# limit the maximum number of simultaneous connections from
# one source IP address
per_source = 250
# Disable TCP delay, makes connection more responsive
flags = NODELAY
user = nagios
server = /usr/bin/unixcat
server_args = /usr/local/nagios/var/rw/live
# configure the IP address(es) of your Nagios server here:
# only_from = 127.0.0.1 10.0.20.1 10.0.20.2
disable = no
}
2. service xinetd restart
3. on distributed monitoring check_mk server
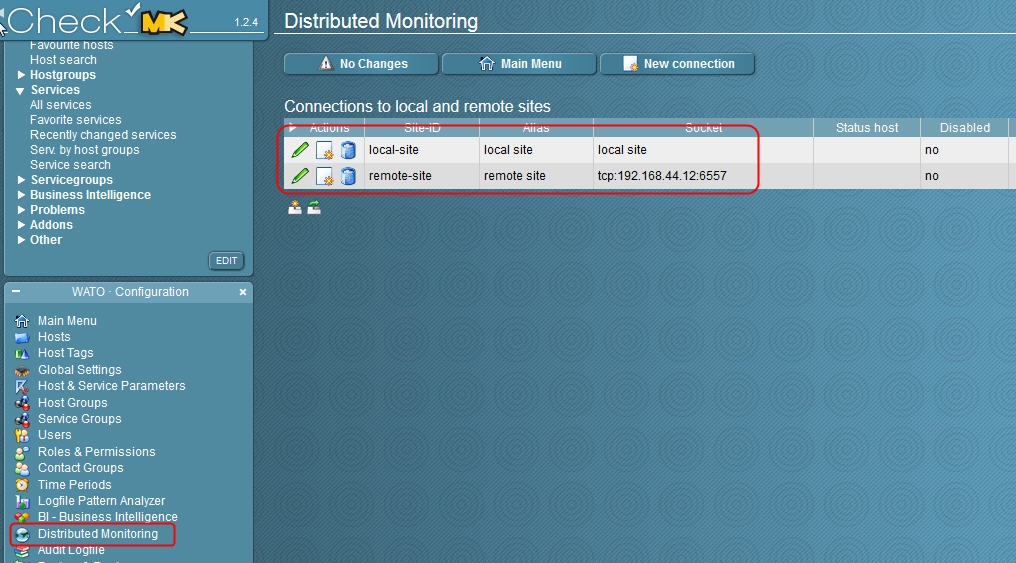
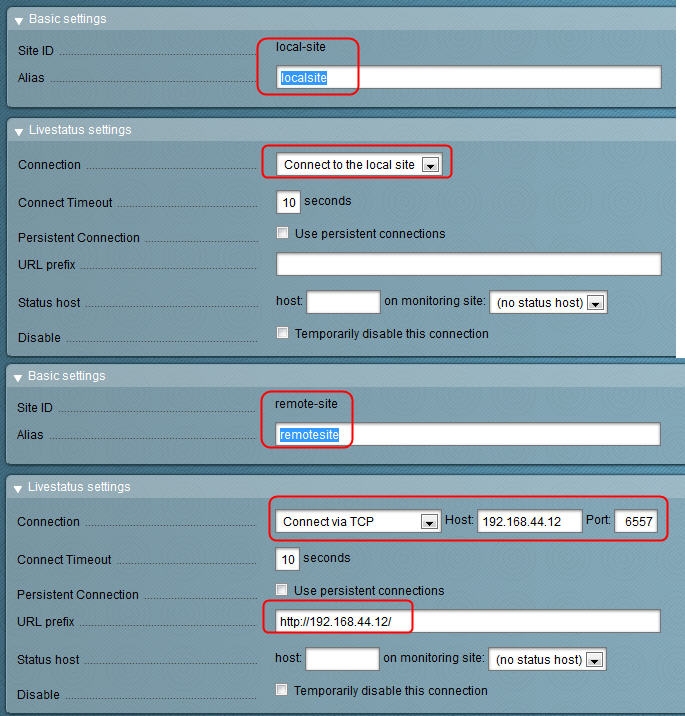
4. now it's ok, only works for Perf-O-Meter column for PNP graph in current version

5. using mod_proxy to get PNP graph -- undergoing
Setup Legacy Checks (no agent or SNMP on client)
1. on Nagios check_mk server
vi /etc/hosts
192.168.1.11 linuxtestclient
vi /usr/local/check_mk/etc/main.mk
all_hosts = [ 'localhost','linuxtestclient' ]
#Legacy Checks
extra_nagios_conf += r"""
# You can get command definition from nagios command.cfg
define command {
command_name check_ssh
command_line $USER1$/check_ssh $ARG1$ $HOSTADDRESS$
}
"""
legacy_checks = [
# command_name!argument, service description, pnp enable, hostname
( ( "check_ssh", "SSH Status", True), [ "linuxtestclient" ] ),
]
2. /usr/local/check_mk/bin/cmk -R

Setup MRPE on client with agent
1. on client
vi /etc/check_mk/mrpe.cfg
#service description, command line for calling the plugin
LOAD /usr/local/nagios/libexec/check_load -w 5.0,4.0,3.0 -c 10.0,6.0,4.0
2. on Nagios check_mk server
vi /etc/hosts
192.168.1.11 linuxtestclient
vi /usr/local/check_mk/etc/main.mk
all_hosts = [ 'localhost','linuxtestclient' ]
3. /usr/local/check_mk/bin/cmk -I --checks=mrpe linuxtestclient
/usr/local/check_mk/bin/cmk -R

使用check_mk MRPE监控percona xtradb cluster
on pxc node:
rpm -ivh percona-nagios-plugins-1.1.4-1.noarch.rpm
yum -y install xinetd
rpm -ivh check_mk-agent-1.2.4p5-1.noarch.rpm check_mk-agent-logwatch-1.2.4p5-1.noarch.rpm
mkdir /etc/nagios
vi /etc/nagios/mysql.cnf
[client]
user = root
password = s3cret
vi /etc/check_mk/mrpe.cfg
#service description, command line for calling the plugin
Threads_running /usr/lib64/nagios/plugins/pmp-check-mysql-status -x Threads_running -w 20 -c 40