Utility2:Appropriate Evaluation Policy
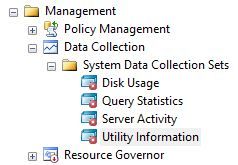
UCP收集所有Managed Instance的数据的机制,是通过启用各个Managed Instances上的Collection Set:Utility information(位于Management->Data Collection->System Data collection Sets),Utility Information 是On Demand 模式。UCP每15分钟调用Utility information一次,Utility information 收集所在Instance 对CPU 和Storage 资源的使用数据,发送到UCP。这样UCP就能获各个Managed Instances的资源利用数据,并存储在sysutility_udw 数据库中,通过dashboard report 显示一个consolidated view给DBA,便于DBA监控多个managed instances的资源利用率。
1,Utility information

2,UCP收集数据的频率
collection Set Upload Frequency :Every 15 minutes,Frequency Value不可更改。

3,Evaluation Policy
Evaluation Policy 有三部分组成:Time Window,Fault Tolerance 和 Collection Frequency.
Collection Requency 是 Every 15 minutes,不可更改。
Time Window 和 Fault Tolerance 显示Volatile Resource Policy Evaluation Tab中,可以配置,默认的设置如图
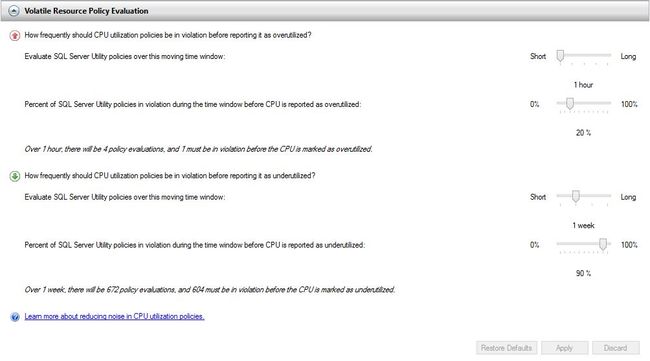
默认设置:time window 是 1hour, Fault tolerance 是20%,Upload Frequency 是15Minutes。
意思是,在1hour内,UCP会收集4次数据,如果有1次数据超出Overutilized threshold,那么 percent in violation 就是1/4=25%,由于 25%>20%,因此,UCP 评估的结果是Overutilized。默认的设置是不允许任何一次数据超出Overutilized threshold,而不被评估为Overutilized,意思是只要有一次Overutilized,那么就会被mark 为 Overutilized。
如果对资源的Overutilized不是很 sensitive,允许1hour内出现1次Overutilized,如果其他3次没有Overutilized,那么USP就不会Mark为Overutilized。实现这个scenario,可以设置较大的Fault tolerance,也可以设置较大的Overutilized threshold。
Example1,设置 Fault tolerance 是30%
time window 是 1hour, Fault tolerance 是30%,Upload Frequency 是15Minutes。
意思是,在1hour内,UCP会收集到4次数据,如果有1次数据超出Overutilized threshold,那么percent in violation 就是1/4=25%,由于 25%<30%,因此,UCP 评估的结果是没有Overutilized。如果25% 大于Underutilized 的 Fault tolerance,那么UCP会标记Instance处于Well Utilized状态。

Example2,设置更大的Overutilized threshold
思路是使资源利用达不到Overutilized threshold,默认的Overutilized threshold 设置是70%。
如果一个小时内,资源的utility 是 75%,60%,65%,40%,有1次的utility超出70%,那么Instance就被标记为Overutilized;
如果将Overutilized threshold 设置是80%,那么,资源的utility都不会超过80%,那么Instance就不会被标记为Overutilized。
可以通过配置Global Policy 或 Individual Policy来 设置Overutilized threshold 的值。
A: 配置Global Policy

B:配置Individual Policy

Appenix: 引用MSDN:《Reduce Noise in CPU Utilization Policies (SQL Server Utility)》
-
The data collection interval is 15 minutes. This value is not configurable.
-
The default upper threshold processor utilization policy is 70%. Options range from 0% to 100%.
-
The default evaluation period for processor overutilization is 1 hour. Options range from 1 hour to 1 week.
-
The default percentage of data points in violation before CPU is reported as overutilized is 20%. Options range from 0% to 100%.
For example, based on default values, 4 data points will be collected every hour, and the policy threshold is 20%. So by default, any violation in a 1-hour collection period will be 25% of 4 data points. The default values report any violation of the CPU overutilization policy threshold.
To reduce noise generated by a single violation, consider the following options:
-
Increase the evaluation period by 1 increment to 6 hours. A single violation in 6 hours would be 1 data point in a sample size of 24. In this case, the policy would tolerate 4 violations of the policy threshold (16.7% of data points) in 6 hours, but would report overutilization for 5 or more violations (>20% of data points) in a 6-hour collection period.
-
Increase the tolerance for percentage of violations by 1 increment to 30%. A single violation in 1 hour would be 1 data point in a sample size of 4. In this case, the policy would tolerate 1 violation per hour, but would report overutilization for 2 or more violations (>30% of data points) in a 1-hour collection period.
-
Increase policy thresholds for SQL Server managed instance and data-tier application processor utilization. For more information about how to change the global CPU utilization policies for managed instances of SQL Server or data-tier applications, see Utility Administration (SQL Server Utility). For more information about how to change CPU utilization policies for individual instances of SQL Server, see Managed Instance Details (SQL Server Utility). For more information about how to change CPU utilization policies for individual data-tier applications, see Deployed Data-tier Application Details (SQL Server Utility).
-
The data collection interval is 15 minutes. This value is not configurable.
-
The default lower threshold for processor utilization policy is 0%. Options range from 0% to 100%.
-
The default evaluation period for processor underutilization is 1 week. Options range from 1 day to 1 month.
-
The default percentage of data points in violation before CPU is reported as underutilized is 90%. Options range from 0% to 100%.
Based on default values, 672 data points are collected every week, but the policy threshold is 0%. So by default, this policy does not generate processor underutilization violations. For more information about how to change the global CPU utilization policies for managed instances of SQL Server or data-tier applications, see Utility Administration (SQL Server Utility). For more information about how to change CPU utilization policies for individual instances of SQL Server, see Managed Instance Details (SQL Server Utility). For more information about how to change CPU utilization policies for individual data-tier applications, see Deployed Data-tier Application Details (SQL Server Utility).
参考文档:
Reduce Noise in CPU Utilization Policies (SQL Server Utility)