Jrockit之Understanding JIT Compilation and Optimizations
This section offers a high-level look at how the Oracle JRockit JVM generates code. It provides information on JIT compilation and how the JVM optimizes code to ensure high performance. This section contains information on the following subjects:
More than a "Black Box"
How the JRockit JVM Compiles Code
An Example Illustrating Some Code Optimizations
More than a “Black Box”
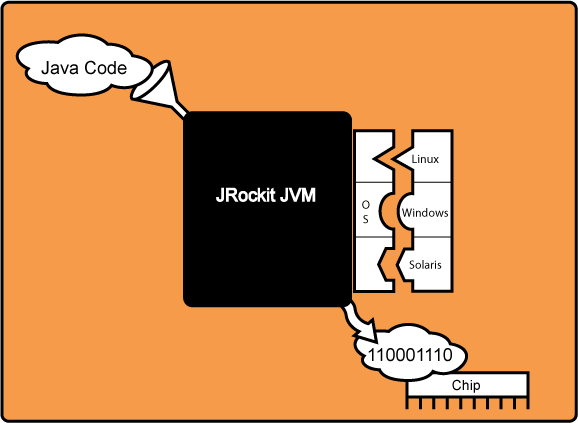
From the user’s point of view, the JRockit JVM is merely a black box that “converts” Java code to highly optimized machine code: you put Java code in one end of the JVM and out the other end comes machine code for your particular platform (see Figure 2-1).
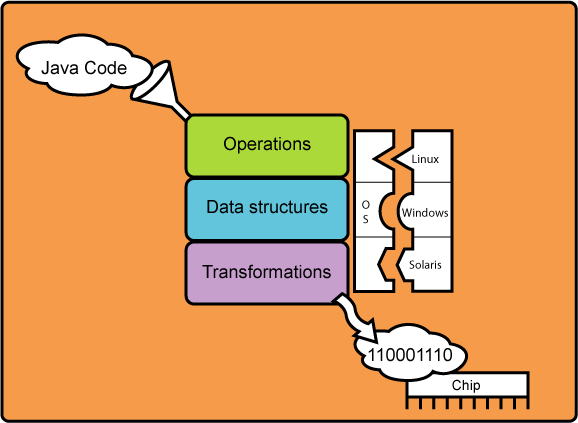
When lifting the lid of the black box you will see different actions that are taken before the code is optimized for your particular operating system. There are certain operations, data structure changes, and transformations that take place before the code leaves the JVM (see Figure 2-2).
How the JRockit JVM Compiles Code
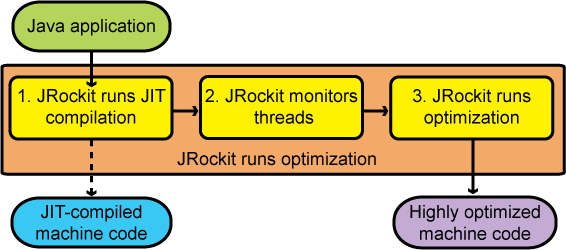
The code generator in the JRockit JVM runs in the background during the entire run of your Java application, automatically adapting the code to run its best. The code generator works in three steps, as described inFigure 2-3.
1. The JRockit JVM Runs JIT Compilation
The first step of code generation is the Just-In-Time (JIT) compilation. This compilation allows your Java application to start and run while the code that is generated is not highly optimized for the platform. Although the JIT is not actually part of the JVM standard, it is, nonetheless, an essential component of Java. In theory, the JIT comes into use whenever a Java method is called, and it compiles the bytecode of that method into native machine code, thereby compiling it “just in time” to execute.
After a method is compiled, the JRockit JVM calls that method’s compiled code directly instead of trying to interpret it, which makes the running of the application fast. However, during the beginning of the run, thousands of new methods are executed, which can make the actual start of the JRockit JVM slower than other JVMs. This is due to a significant overhead for the JIT to run and compile the methods. So, if you run a JVM without a JIT, that JVM starts up quickly but usually runs slower. If you run the JRockit JVM that contains a JIT, it can start up slowly, but then runs quickly. At some point, you might find that it takes longer to start the JVM than to run an application.
Compiling all of the methods with all available optimizations at startup would negatively impact the startup time. Thus the JIT compilation does not fully optimize all methods at startup.
2. The JRockit JVM Monitors Threads
During the second phase, the JRockit JVM uses a sophisticated, low-cost, sampling-based technique to identify which functions merit optimization: a “sampler thread” wakes up at periodic intervals and checks the status of several application threads. It identifies what each thread is executing and notes some of the execution history. This information is tracked for all the methods and when it is perceived that a method is experiencing heavy use—in other words, is “hot”—that method is earmarked for optimization. Usually, a flurry of such optimization opportunities occur in the application’s early run stages, with the rate slowing down as execution continues.
3. The JRockit JVMRuns Optimization
During the third phase, the JVM runs an optimization round of the methods that it perceives to be the most used—“hot”—methods. This optimization is run in the background and does not disturb the running application.
An Example Illustrating Some Code Optimizations
This example illustrates some ways in which the JRockit JVM optimizes Java code. The example is fairly short and simple, but it will give you a general idea of how the actual Java code can be optimized. Note that there are many ways of optimizing Java applications that are not discussed here.
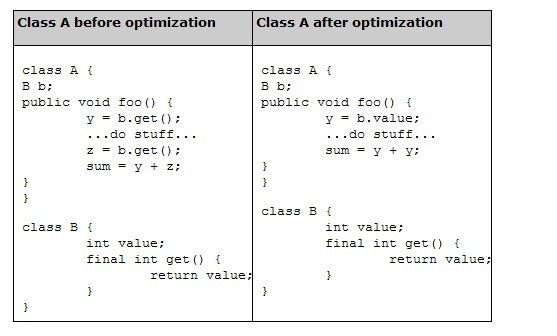
In Table 2-1 you can see how the code before and after optimization. The differences might not look substantial, but note that the optimized code does not need to run down to Class B every time Class A is run.
Table 2-1 Exampleof before and after optimization of a class

When the Oracle JRockit JVM optimizes code it goes through several steps to get the best optimization possible. The example fromTable 2-1 shows on how a method looks like before and after the optimization. InTable 2-2 you find an explanation of what can happen in a few optimization steps that the JVM might go through at the level of the Java application code itself. Note that several optimizations appear at the level of the assembler code, however.


