图像显示
load clown
image(X),colormap(map)
axis off
hold on
rect  = [ 150 40 80 70]
h = rectangle('position',rect);
rect =
   150    40    80    70
It's kind of hard to see this black edge of the rectangle outlining the eye on the right. Let me make it more visible by thickening it, and placing a thinner line inside.
set(h,'LineWidth',5)
h2 = rectangle('position',rect);
set(h2,'EdgeColor','w','LineWidth',2)
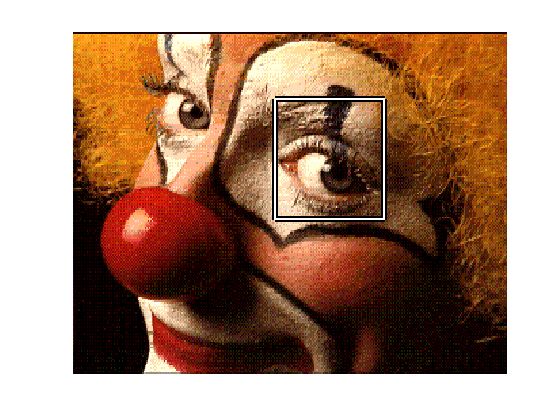
Let me adjust the linestyle instead of the width.
set(h,'LineWidth',2,'LineStyle','-')
set(h2,'LineStyle',':')
Making Markers Visible
Similarly, you can ensure that markers are visible on your plots by exploiting the separable colors for the face and edge.
delete([h h2])
hm = plot(60,125,'s')
set(hm,'MarkerSize',10,'MarkerEdgeColor','w','MarkerFaceColor','m')
hold off
hm =
          177

load clown
image(X),colormap(map)
hold on
xx = [150 230 230 150]';
yy = [40 40 110 110]';
hp  = patch(xx,yy,'g');
As you can see, the green patch I placed on top of the eye makes it impossible to see the covered region of the image. To get a hint at what lies underneath, I can change the transparency of the patch, by changing the transparency of the patch face.
set(hp,'FaceAlpha',0.2)
hold off