CorePlot-饼状体
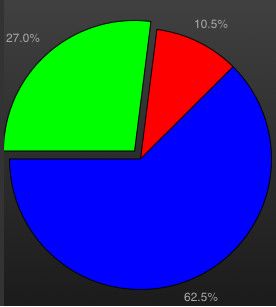
在Core Plot中,饼图是一类特殊的图形。因为它不需要显示坐标轴。数据不以坐标象限内的点表示,而以椭圆中的扇形面积表示。
16.1.1. 饼图的绘制
CorePlot用CPTPieChart 对象代表一个饼图。在 CPTGraph 中添加一个饼图很简单,以下代码向 pieChart 中绘制了一个饼图:
CPTPieChart*piePlot = [[CPTPieChart alloc] init];
piePlot.dataSource = self;
piePlot.pieRadius = 131.0;
piePlot.identifier =@"Pie Chart 1";
piePlot.startAngle = M_PI_4;
piePlot.sliceDirection = CPTPieDirectionCounterClockwise;
piePlot.centerAnchor = CGPointMake(0.5, 0.38);
piePlot.borderLineStyle= [CPTLineStyle lineStyle];
piePlot.delegate = self;
[pieChartaddPlot:piePlot];
[piePlotrelease];
从代码中可见,alloc、init一个 CPTPieChart 对象后,需要设置它的一些属性并 addPlot 到CPTGraph 中。CPTPieChart的属性很多,上述代码使用到了如下属性:
dataSource属性 - 指定饼图的数据源。数据源必须实现 CPTPieDataSource 委托。
pieRadius属性 - 饼图的半径。
startAngle属性 - 第1片扇形的起始角度,默认是PI/2。
sliceDirection属性 - 扇形绘制的方向:正时针、反时针。
centerAnchor属性 - 饼图的重心(旋转时以此为中心)坐标(x,y),以相对于饼图直径的比例表示(0-1)之间。默认和圆心重叠(0.5,0.5)。
borderLineStyle属性 - 饼图边线的样式。
delegate属性 - 指定饼图的事件委托。委托必须实现 CPTPieChartDelegate 中定义的方法。
最重要的是数据源方法。我们假设用数组model 定义了扇形的分布比例,则CPTPieChartDataSource 委托可实现如下:
-(NSUInteger)numberOfRecordsForPlot:(CPTPlot*)plot
{
return[model count];
}
-(NSNumber*)numberForPlot:(CPTPlot *)plot field:(NSUInteger)fieldEnumrecordIndex:(NSUInteger)index
{
return[model objectAtIndex:index];
}
numberOfRecordsForPlot:方法是重要的,它告诉CorePlot 需要绘制几个数据点。当然对于每种图形来说,绘制数据点的方式不一样。对于散点图,每个数据点会被绘制为节点,对于柱状图,每个数据点会被绘制为柱子,而对于饼图,每个数据点用不同弧度的扇形表示。
在CorePlot 具体绘制图形时,它根据数据源方法返回的数据点数来绘制每一个点。每绘制一个点都会来调用numberForPlot:field:recordIndex:方法,但调用的次数不一。因为每种图形在描述每个点时需要的数据不一样。比如柱状图和散点图,每个点以二维表示(x,y),则CorePlot对每个点都会调用两次xxxForPlot:field:recordIndex:方法。每次调用时,依靠field参数来区分是请求x坐标还是y坐标(recordIndex参数则指定是第几个数据点)。
而对于饼图,每个点只需要一个数字描述(百分比),因此只会调用一次xxForPlot:field:recordIndex方法。我们直接根据index索引返回model数组中的数值就可以了。
16.1.2. 显示每个扇形的比例
默认情况下,饼图不显示 Data Label。如果要显示 Data Label,需要实现数据源的 dataLabelForPlot:recordIndex: 方法。以下代码在每个扇形的Data Label上显示百分比数字:
-(CPTLayer*)dataLabelForPlot:(CPTPlot *)plot recordIndex:(NSUInteger)index
{
float f=((NSNumber*)[modelobjectAtIndex:index]).floatValue;
CPTTextLayer *label = [[CPTTextLayeralloc] initWithText:[NSString stringWithFormat:@"%.1f%%",f]];
CPTMutableTextStyle *textStyle =[label.textStyle mutableCopy];
textStyle.color = [CPTColor lightGrayColor];
label.textStyle = textStyle;
[textStyle release];
return [label autorelease];
}
16.1.3. 剥离扇形
对于饼图,我们可以把某块扇形“切除”下来,以此突出该扇形区域。这需要实现数据源方法radialOffsetForPieChart:recordIndex: 方法。以下代码将饼图中第2块扇形“剥离”10个像素点:
-(CGFloat)radialOffsetForPieChart:(CPTPieChart*)piePlot recordIndex:(NSUInteger)index{
return (indexix==1?10:0);
}
16.1.4. 显示图例
图例可用于描述图形(尤其是饼图)的构成部分。以下代码显示了饼图的图例:
CPTLegend *theLegend = [CPTLegendlegendWithGraph:pieChart];
theLegend.numberOfColumns= 1;
theLegend.fill=[CPTFill fillWithColor:[CPTColor lightGrayColor]];
theLegend.borderLineStyle= [CPTLineStyle lineStyle];
theLegend.cornerRadius=5.0;
pieChart.legend= theLegend;
pieChart.legendAnchor=CPTRectAnchorTopRight;
pieChart.legendDisplacement= CGPointMake(-30.0, -30.0);
图例由 CPTLengend 对象表示。上述代码中,分别设置了 CPTLengend 的如下属性:
numberOfColumns属性 - 图例的列数。有时图例太多,单列显示太长,可分为多列显示。
fill属性 - 图例的填充属性,CPTFill 类型。
borderLineStyle属性 - 图例外框的线条样式。
cornerRadiuss属性 - 图例外框的圆角半径。
把一个图例对象赋值给图形的 legend 属性,即可在绘制图形时加上图例。此外还图形对象还有两个和图例相关的重要属性:
legendAnchor属性 - 图例对齐于图框的位置,可以用 CPTRectAnchor 枚举类型,指定图例向图框的4角、4边(中点)对齐。
legendDisplacement属性 - 图例对齐时的偏移距离。注意,对齐时是使用图例的相同锚点和图框的相同锚点对齐。比如,图形的legendAnchor属性是右上角(CPTRectAnchorTopRight),则对齐时用图例的右上角和图框的右上角进行对齐。这个偏移坐标(x,y)就是这两个锚点之间的距离(用图例的锚点坐标减图框的锚点坐标)。默认legendDisplacement为(0,0)。注意这个值的正负关系,比如(-30,-30)和(30,30)是截然相反的,你多试几次就明白了。
图例上的描述文字,从数据本身是看不到的,默认情况下 CorePlot 会以“Pie Chart 1”、“Pie Char 2”来命名。
我们需要实现数据源方法legendTitleForPieChart:recordIndex:来覆盖默认的图例名称:
-(NSString*)legendTitleForPieChart:(CPTPieChart *)pieChart recordIndex:(NSUInteger)index{
switch (index) {
case 0:
return @"其他";
case 1:
return @"Google Android";
case 2:
return @"Apple iOS";
default:
return nil;
}
}
设置某个扇形的颜色:-(CPTFill *)sliceFillForPieChart:(CPTPieChart *)pieChart recordIndex:(NSUInteger)index //CPTPieChartDataSource
点击某个扇形响应操作:-(void)pieChart:(CPTPieChart *)plot sliceWasSelectedAtRecordIndex:(NSUInteger)index //CPTPieChartDelegate
//添加立体效果
- (void)addOverLayFillWithPieChart:(CPTPieChart *)piePlot
{
CPTGradient *gradient = [[CPTGradient alloc]init];
gradient.gradientType = CPTGradientTypeRadial;
//设置颜色变换的颜色和位置
gradient = [gradient addColorStop:[[CPTColor blackColor] colorWithAlphaComponent:0.1] atPosition:0.9];
gradient = [gradient addColorStop:[[CPTColor blackColor] colorWithAlphaComponent:0.5] atPosition:0.5];
gradient = [gradient addColorStop:[[CPTColor blackColor] colorWithAlphaComponent:0.3] atPosition:0.9];
piePlot.overlayFill = [CPTFill fillWithGradient:gradient];
}
