malab中支持向量机使用
1,下载SVM工具箱:http://see.xidian.edu.cn/faculty/chzheng/bishe/indexfiles/indexl.htm
2,安装到matlab文件夹中
1)将下载的SVM工具箱的文件夹放在/matlab71/toolbox/下
2)打开matlab->File->Set Path中添加SVM工具箱的文件夹
现在,就成功的添加成功了.
可以测试一下:在matlab中输入which svcoutput 回车,如果可以正确显示路径,就证明添加成功了,例如:
C:/Program Files/MATLAB71/toolbox/svm/svcoutput.m
3,用SVM做分类的使用方法
1)在matlab中输入必要的参数:X,Y,ker,C,p1,p2
我做的测试中取的数据为:
N = 50;
n=2*N;
randn('state',6);
x1 = randn(2,N)
y1 = ones(1,N);
x2 = 5+randn(2,N);
y2 = -ones(1,N);
figure;
plot(x1(1,:),x1(2,:),'bx',x2(1,:),x2(2,:),'k.');
axis([-3 8 -3 8]);
title('C-SVC')
hold on;
X1 = [x1,x2];
Y1 = [y1,y2];
X=X1';
Y=Y1';
其中,X是100*2的矩阵,Y是100*1的矩阵
C=Inf;
ker='linear';
global p1 p2
p1=3;
p2=1;
然后,在matlab中输入:[nsv alpha bias] = svc(X,Y,ker,C),回车之后,会显示:
Support Vector Classification
_____________________________
Constructing ...
Optimising ...
Execution time: 1.9 seconds
Status : OPTIMAL_SOLUTION
|w0|^2 : 0.418414
Margin : 3.091912
Sum alpha : 0.418414
Support Vectors : 3 (3.0%)
nsv =
3
alpha =
0.0000
0.0000
0.0000
0.0000
0.0000
2)输入预测函数,可以得到与预想的分类结果进行比较.
输入:predictedY = svcoutput(X,Y,X,ker,alpha,bias),回车后得到:
predictedY =
1
1
1
1
1
1
1
1
1
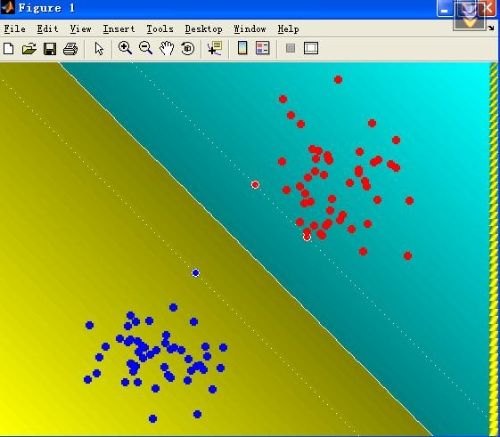
3)画图
输入:svcplot(X,Y,ker,alpha,bias),回车
补充:
X和Y为数据,m*n:m为样本数,n为特征向量数
比如:取20组训练数据X,10组有故障,10组无故障的,每个训练数据有13个特征参数,则m=20,n=13
Y为20*1的矩阵,其中,10组为1,10组为-1.
对于测试数据中,如果取6组测试数据,3组有故障,3组无故障的,则m=6,n=13
Y中,m=6,n=1
