Apache自带ab性能测试工具学习
目前大多数测试人员喜欢使用具有图形界面的Loadrunner作为web的性能测试工具,其实在Linux系统上有很多开源的性能测试工具很好,而且这些工具很小,又是开源产品。对与测试人员来是一个很好的选择。
以前在做web性能测试的时候,使用了一段时间ab工具,但是一直没有整理出来,知识就没有积累下来。
(1)ab工具位置
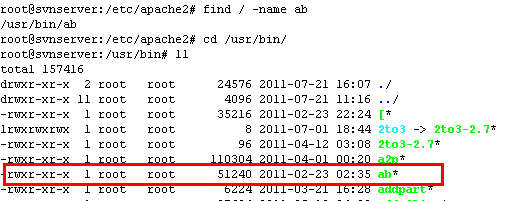
一般情况下在Apache的bin目录下,但也不排除在其它目录,目前我使用的Ubuntu Server 11.04,使用apt-get安装的apache2,ab就没有在apache2目录下,而是在/usr/bin目录下。见下图
(2)ab的基本格式
NAME
ab - Apache HTTP server benchmarking tool
SYNOPSIS
ab [ -A auth-username:password ] [ -b windowsize ] [ -c concurrency ] [ -C cookie-name=value ] [ -d ] [ -e csv-file ] [ -f protocol ] [ -g gnuplot-file ] [ -h ] [ -H custom-header ] [ -i ]
[ -k ] [ -n requests ] [ -p POST-file ] [ -P proxy-auth-username:password ] [ -q ] [ -r ] [ -s ] [ -S ] [ -t timelimit ] [ -T content-type ] [ -u PUT-file ] [ -v verbosity] [ -V ] [ -w ] [
-x <table>-attributes ] [ -X proxy[:port] ] [ -y <tr>-attributes ] [ -z <td>-attributes ] [ -Z ciphersuite ] [http[s]://]hostname[:port]/path
SUMMARY
ab is a tool for benchmarking your Apache Hypertext Transfer Protocol (HTTP) server. It is designed to give you an impression of how your current Apache installation performs. This espe-
cially shows you how many requests per second your Apache installation is capable of serving.
OPTIONS
-A auth-username:password
Supply BASIC Authentication credentials to the server. The username and password are separated by a single : and sent on the wire base64 encoded. The string is sent regardless of
whether the server needs it (i.e., has sent an 401 authentication needed).
-b windowsize
Size of TCP send/receive buffer, in bytes.
-c concurrency
Number of multiple requests to perform at a time. Default is one request at a time.
-C cookie-name=value
Add a Cookie: line to the request. The argument is typically in the form of a name=value pair. This field is repeatable.
-d Do not display the "percentage served within XX [ms] table". (legacy support).
-e csv-file
Write a Comma separated value (CSV) file which contains for each percentage (from 1% to 100%) the time (in milliseconds) it took to serve that percentage of the requests. This is
usually more useful than the 'gnuplot' file; as the results are already 'binned'.
-f protocol
Specify SSL/TLS protocol (SSL2, SSL3, TLS1, or ALL).
-g gnuplot-file
Write all measured values out as a 'gnuplot' or TSV (Tab separate values) file. This file can easily be imported into packages like Gnuplot, IDL, Mathematica, Igor or even Excel. The
labels are on the first line of the file.
-h Display usage information.
-H custom-header
Append extra headers to the request. The argument is typically in the form of a valid header line, containing a colon-separated field-value pair (i.e., "Accept-Encoding:
zip/zop;8bit").
-i Do HEAD requests instead of GET.
-k Enable the HTTP KeepAlive feature, i.e., perform multiple requests within one HTTP session. Default is no KeepAlive.
-n requests
Number of requests to perform for the benchmarking session. The default is to just perform a single request which usually leads to non-representative benchmarking results.
-p POST-file
File containing data to POST. Remember to also set -T.
-P proxy-auth-username:password
Supply BASIC Authentication credentials to a proxy en-route. The username and password are separated by a single : and sent on the wire base64 encoded. The string is sent regardless
of whether the proxy needs it (i.e., has sent an 407 proxy authentication needed).
-q When processing more than 150 requests, ab outputs a progress count on stderr every 10% or 100 requests or so. The -q flag will suppress these messages.
-r Don't exit on socket receive errors.
-s When compiled in (ab -h will show you) use the SSL protected https rather than the http protocol. This feature is experimental and very rudimentary. You probably do not want to use
it.
-S Do not display the median and standard deviation values, nor display the warning/error messages when the average and median are more than one or two times the standard deviation
apart. And default to the min/avg/max values. (legacy support).
-t timelimit
Maximum number of seconds to spend for benchmarking. This implies a -n 50000 internally. Use this to benchmark the server within a fixed total amount of time. Per default there is no
timelimit.
-T content-type
Content-type header to use for POST/PUT data, eg. application/x-www-form-urlencoded. Default: text/plain.
-u PUT-file
File containing data to PUT. Remember to also set -T.
-v verbosity
Set verbosity level - 4 and above prints information on headers, 3 and above prints response codes (404, 200, etc.), 2 and above prints warnings and info.
-V Display version number and exit.
-w Print out results in HTML tables. Default table is two columns wide, with a white background.
-x <table>-attributes
String to use as attributes for <table>. Attributes are inserted <table here >.
-X proxy[:port]
Use a proxy server for the requests.
-y <tr>-attributes
String to use as attributes for <tr>.
-z <td>-attributes
String to use as attributes for <td>.
-Z ciphersuite
Specify SSL/TLS cipher suite (See openssl ciphers).
(3)ab常用的情况以及相应的参数含义
-n 53
本次测试场景执行中,执行请求的次数,本例为53次,默认情况下仅执行一次
-c 10
每次发送多少个请求,本例是每次发起10个请求,默认情况是发送一个请求。
-t
设置测试进行的最大时间,默认没有限制,直到执行完成为止。
-p
POST请求需要的数据
-T
POST数据所使用的Content-type头信息
-C
cookie-name=value 对请求附加一个Cookie:值, 如name=value的一个参数对,此参数可以重复。
(4)测试结果分析
This is ApacheBench, Version 2.3 <$Revision: 655654 $>
Copyright 1996 Adam Twiss, Zeus Technology Ltd, http://www.zeustech.net/
Licensed to The Apache Software Foundation, http://www.apache.org/
Benchmarking 10.10.30.230 (be patient).....done
Server Software: Apache/2.2.17 //服务器web服务器版本
Server Hostname: 10.10.30.230 //服务器地址
Server Port: 80 //服务器侦听端口
Document Path: /work //测试服务路径
Document Length: 6219 bytes //测试页面大小
Concurrency Level: 10 //并发数
Time taken for tests: 2.475 seconds //整个测试持续的时间
Complete requests: 10 //完成的请求次数
Failed requests: 0 //失败的请求次数
Write errors: 0 //写错误
Total transferred: 67592 bytes //总网络传输量
HTML transferred: 62190 bytes //整个测试中HTML传输量
Requests per second: 4.04 [#/sec] (mean) //每秒处理事务数(平均值)
Time per request: 2475.455 [ms] (mean) //平均事务响应时间(平均值)
Time per request: 247.546 [ms] (mean, across all concurrent requests) //每个请求实际运行时间的平均值
Transfer rate: 26.66 [Kbytes/sec] received //平均每秒网络上的流量,可以帮助排除是否存在网络流量过大导致响应时间延长的问题
Connection Times (ms)
min mean[+/-sd] median max
Connect: 1 4 4.8 1 11
Processing: 24 734 1085.6 102 2307
Waiting: 23 733 1085.5 101 2306
Total: 25 738 1090.4 103 2318
Percentage of the requests served within a certain time (ms)
50% 103
66% 104
75% 2317
80% 2317
90% 2318
95% 2318
98% 2318
99% 2318
100% 2318 (longest request)
//整个场景中所有请求的响应情况。在场景中每个请求都有一个响应时间,其中50%的用户响应时间小于103 毫秒,60% 的用户响应时间小于104 毫秒,最大的响应时间小于2318毫秒
