matplotlib绘图手册入门
散点图
#!/usr/bin/python
import matplotlib.pyplot as plt
import numpy as np

def scatter(mat,col1,col2,lables):
    fig = plt.figure()
    ax = fig.add_subplot(111)
    ax.scatter(mat[:,col1],mat[:,col2],\
        c=15.0 * np.array(lables),s=15.0 * np.array(lables))
    plt.show()
折线图
#!/usr/bin/python

import matplotlib.pyplot as plt

def plot_pic():
	  x = range(6)#x轴
	  y = [i ** 3 + i * 10 + 7 for i in x]#Y轴值
	  plt.plot(x,y)#此处x轴可以缺省,默认为0~N-1
	  plt.show()
import matplotlib.pyplot as plt
import numpy as np

def mulitplot_pic():#多条折线,三条(x,x*3),(x,x**2),(x,x*30)
	  x = np.arange(1,10)
	  plt.plot(x, x * 3, x, x**2,x,x*30)#或者plt.plot();plt.plot()
	  plt.show()
添加网格
plt.grid(True)
设置坐标范围
plt.axis()#显示坐标范围
plt.axis([0,10,-1,30])#设置坐标范围,[xmin, xmax, ymin, ymax]
plt.axis(xmin=NNN, ymax=NNN)#另外一种设置方式
plt.xlim()#x轴范围
plt.ylim()#y轴范围
添加标签
plt.ylabel('This is the Y axis')
plt.xlabel('This is the X axis')
添加标题和图例
plt.title('Simple plot')
plt.plot(x, x * 3)
plt.plot(x, x * 10)
plt.legend(['Normal', 'Fast'])
plt.plot(x, x*1.5, label='Normal')
plt.plot(x, x*3.0, label='Fast')
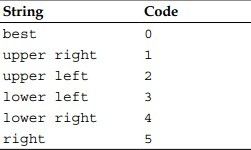
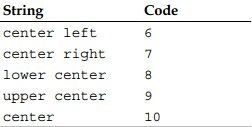
plt.legend()#legend方法允许指定位置loc='best'指定图例的位置

 loc取值
loc取值
保存图片文件
plt.savefig('plot123.png')
matplotlib.rcParams['figure.figsize']#图片像素
matplotlib.rcParams['savefig.dpi']#分辨率
plt.savefig('plot123_2.png', dpi=200)#指定分辨率
#默认的像素:[8.0,6.0],分辨率为100,指定dpi=200,图片尺寸为1600*1200
配置matplotlib
在Linux下,全局配置文件为:/etc/matplotlibrc,个性文件:$HOME/.matplotlib/matplotlibrc
mpl.rcParams['<param name>'] = <value>
mpl.rcParams['figure.figsize'] = (4, 3)
mpl.rc('line', linewidth=4, linecolor='b')#等价
mpl.rcParam['line.linewidth'] = 4
mpl.rcParam['line.linecolor'] = 'b'
matplotlib.rcdefaults()#存储默认值
