Matlab画函数图学习笔记3
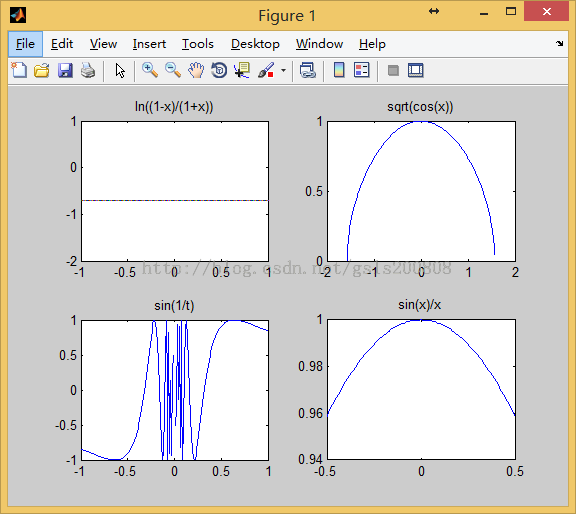
1.选择合适的步长绘制下列函数的图形。
(1)ln((1-x)/(1+x)),x∈(-1,1)
(2)sqrt(cos(x)),x∈[-π/2,π/2]
(3)sin(1/t),t∈(-1,0)∪(0,1)

(2)cos(t)sin(t)
(3)2t^2+1
5.绘制极坐标曲线ρ=asin(b+nθ),并分析a,b,n
fplot不同于plot,能对函数自适应采样,即能发现并对曲线变化率大的区段进行密集采样,可以更好的反映函数的变化规律;能够对曲线变化率小的区段进行稀疏采样,可以提高绘图速度
7.绘制下列函数的带底座的三维图形和带等高线的三维图形
(1)f(x,y)=x^2/(a^2)+y^2/(b^2)
(2)f(x,y)=xy
(3)f(x,y)=sin(xy)
8.绘制二维正态分布密度函数f(x,y)=1/2π*e^(-1/2(x^2+y^2))的三维图形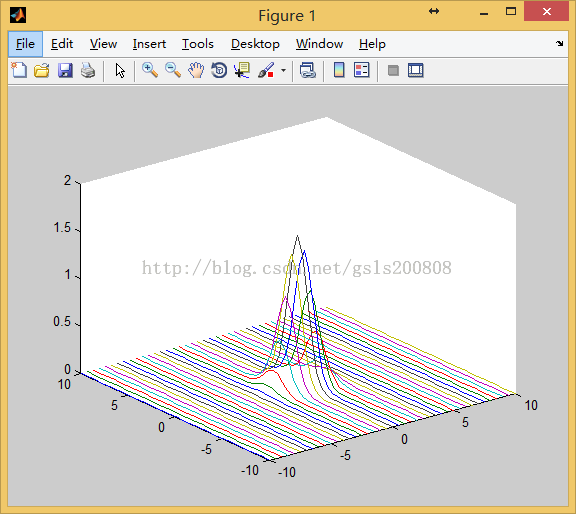
9.用不同的线性和颜色在同一坐标内绘制曲线y1=2e^(-0.5x)、y2=sin(2πx)的图形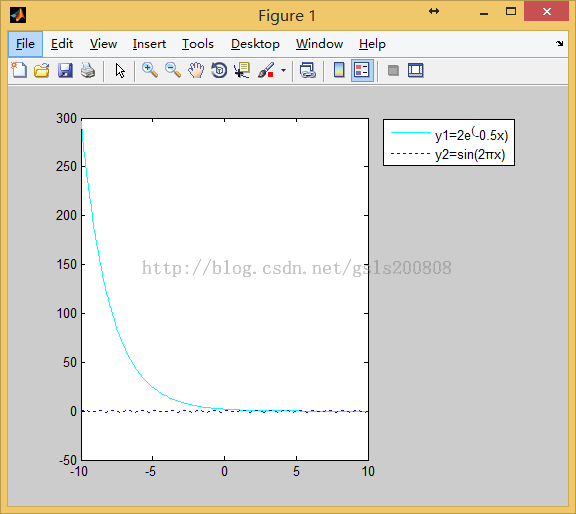
10.绘制方程f=y/(1+x^2+y^2),在x=[-2 2],y=[-1 1]区间的图形
(1)ln((1-x)/(1+x)),x∈(-1,1)
(2)sqrt(cos(x)),x∈[-π/2,π/2]
(3)sin(1/t),t∈(-1,0)∪(0,1)
(4)sin(x)/x,x∈(-0.5,0)∪(0,0.5)
clear
clc
x1=-1+eps:0.01:1;
y1=log((1-x1)/(1+x1));
x2=-pi/2:0.01:pi/2;
y2=sqrt(cos(x2));
x3=-1:0.01:1;
y3=sin(1./x3);
x4=-0.5+eps:0.01:0.5;
y4=sin(x4)./x4;
subplot(221);plot(x1,y1);title('ln((1-x)/(1+x))')
subplot(222);plot(x2,y2);title('sqrt(cos(x))')
subplot(223);plot(x3,y3);title('sin(1/t)')
subplot(224);plot(x4,y4);title('sin(x)/x')
2.在同一坐标下绘制函数x,x^2,-x^2,xsin(x)在x∈(0,π)的曲线
可以用hold on或者y矩阵%y矩阵
clear
clc
x=0:0.01:pi;
y(1,:)=x;
y(2,:)=x.^2;
y(3,:)=-x.^2;
y(4,:)=x.*sin(x);
plot(x,y)
legend('x','x^2','-x^2','xsin(x)',-1)

%hold on
clear
clc
x=0:0.01:pi;
plot(x,x,'b');
hold on
plot(x,x.^2,'c');
plot(x,-x.^2,'g');
plot(x,x.*sin(x),'k');
legend('x','x^2','-x^2','xsin(x)',-1)
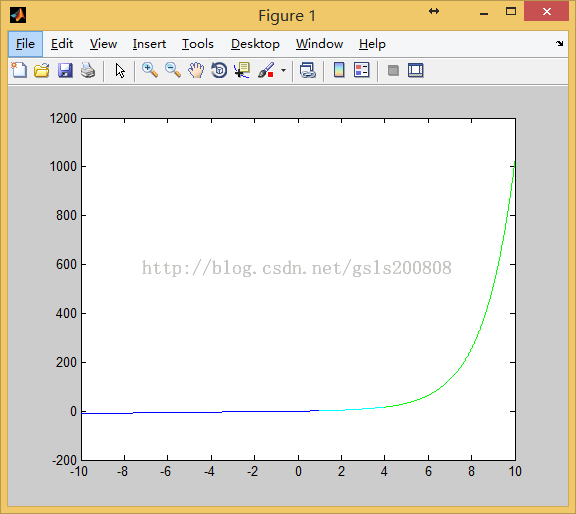
3.绘制如下函数图形y=x,x∈(-10,1);y=x^2,x∈[1,4];y=2^x,x∈(4,10)
clear
clc
x1=-10+eps:0.01:1;
x2=1:0.01:4;
x3=4+eps:0.01:10;
plot(x1,x1,'b');
hold on
plot(x2,x2.^2,'c');
plot(x3,2.^x3,'g');
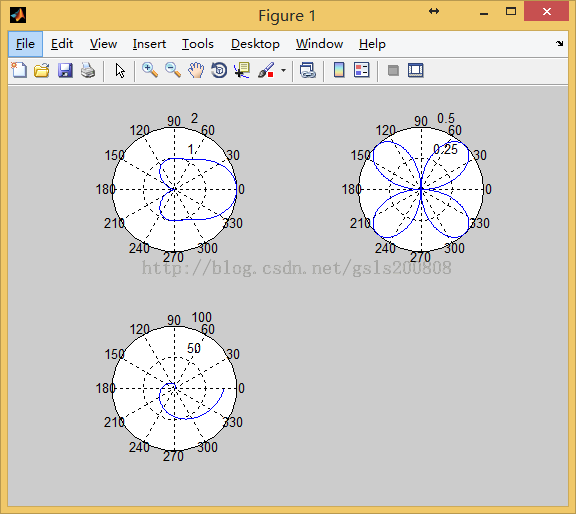
4.在极坐标系中绘制下列函数的曲线
(1)(cos(t))^3-1(2)cos(t)sin(t)
(3)2t^2+1
clear
clc
t=0:0.01:2*pi;
r1=(cos(t)).^3-1;
r2=cos(t).*sin(t);
r3=2.*(t.^2)+1;
subplot(221);polar(t,r1)
subplot(222);polar(t,r2)
subplot(223);polar(t,r3)

5.绘制极坐标曲线ρ=asin(b+nθ),并分析a,b,n
clear
clc
a=1;
b=0;
n=1;
t=0:0.01:2*pi;
r=a.*sin(b+n.*t);
polar(t,r)
6.分别用plot和fplot函数绘制y=sin(1/x),x≠0的曲线,并分析两条曲线的差别。
clear
clc
x=-5+eps:0.01:5;
y=sin(1./x);
subplot(121);plot(x,y);title('plot');
subplot(122);fplot('sin(1/x)',[-5,5]);title('fplot')
fplot不同于plot,能对函数自适应采样,即能发现并对曲线变化率大的区段进行密集采样,可以更好的反映函数的变化规律;能够对曲线变化率小的区段进行稀疏采样,可以提高绘图速度
7.绘制下列函数的带底座的三维图形和带等高线的三维图形
(1)f(x,y)=x^2/(a^2)+y^2/(b^2)
(2)f(x,y)=xy
(3)f(x,y)=sin(xy)
clear
clc
a=5;b=4;
x=-10:0.5:10;
y=-8:0.5:8;
[X,Y]=meshgrid(x,y);
Z1=X.^2/(a^2)+Y.^2/(b^2);
Z2=X.*Y;
Z3=sin(X.*Y);
subplot(231);
meshz(X,Y,Z1);
title('带底座的f(x,y)=x^2/(a^2)+y^2/(b^2)');
subplot(234);
meshc(X,Y,Z1);
title('带等高线的f(x,y)=x^2/(a^2)+y^2/(b^2)');
subplot(232);
meshz(X,Y,Z2);
title('带底座的f(x,y)=xy');
subplot(235);
meshc(X,Y,Z2);
title('带等高线的f(x,y)=xy');
subplot(233);
meshz(X,Y,Z3);
title('带底座的f(x,y)=sin(xy)');
subplot(236);
meshc(X,Y,Z3);
title('带等高线的f(x,y)=sin(xy)');
8.绘制二维正态分布密度函数f(x,y)=1/2π*e^(-1/2(x^2+y^2))的三维图形
clear
clc
x=-10:0.5:10;
y=-10:0.5:10;
[X,Y]=meshgrid(x,y);
Z=1/2*pi*exp(-1/2*(X.^2+Y.^2));
plot3(X,Y,Z);

9.用不同的线性和颜色在同一坐标内绘制曲线y1=2e^(-0.5x)、y2=sin(2πx)的图形
clear
clc
x=-10:0.1:10;
plot(x,2*exp(-0.5*x),'c-')
hold on
plot(x,sin(2*pi*x),'b:')
legend('y1=2e^(-0.5x)','y2=sin(2πx)',-1)

10.绘制方程f=y/(1+x^2+y^2),在x=[-2 2],y=[-1 1]区间的图形
clear
clc
x=-2:0.01:2;
y=-1:0.01:1;
[X,Y]=meshgrid(x,y);
Z=Y./(1+X.^2+Y.^2);
plot3(X,Y,Z);

